Why Polkadot price upside is limited to $21
- Polkadot price has created a market structure break below the April 11 swing low, signaling a quick run-up.
- DOT bulls to take control and propel its market value up by 25%.
- A daily candlestick close below $15.30 will invalidate the bullish thesis.

Polkadot price has revealed a bottoming process that suggests a reversal in trend is likely. This development indicates that DOT is ready for a quick run-up to the immediate resistance barrier.
Polkadot price gives uptrend another go
Polkadot price rallied 46% between January 24 and February 8, and created a range extending from $15.83 to $23.15. DOT has been trading in the range since. As explained earlier, rangebound moves are easy to predict and trade.
More often than not, the asset first sweeps a limit, which is a signal that it will move to the other side and vice versa. If the momentum is high after deviation, the asset continues to head in that direction.
For Polkadot price, a quick deviation below the swing low at $15.83 was followed by a 69% upswing that established a swing high at $23.85. Due to a lack of momentum and investors booking profits, DOT corrected by 28% and slide below the range’s midpoint at $19.51 and set a swing low at $17 on April 11.
Yesterday’s downtick created a lower low, signaling a market structure break (MSB). Therefore, a move above the April 21 swing high at $19.68 will kick-start an uptrend.
In such a case, investors can expect Polkadot price to make its way to the breaker, which extends from $21.08 to $23.06. This run-up would constitute a 25% gain and is likely where the upside is capped for DOT.
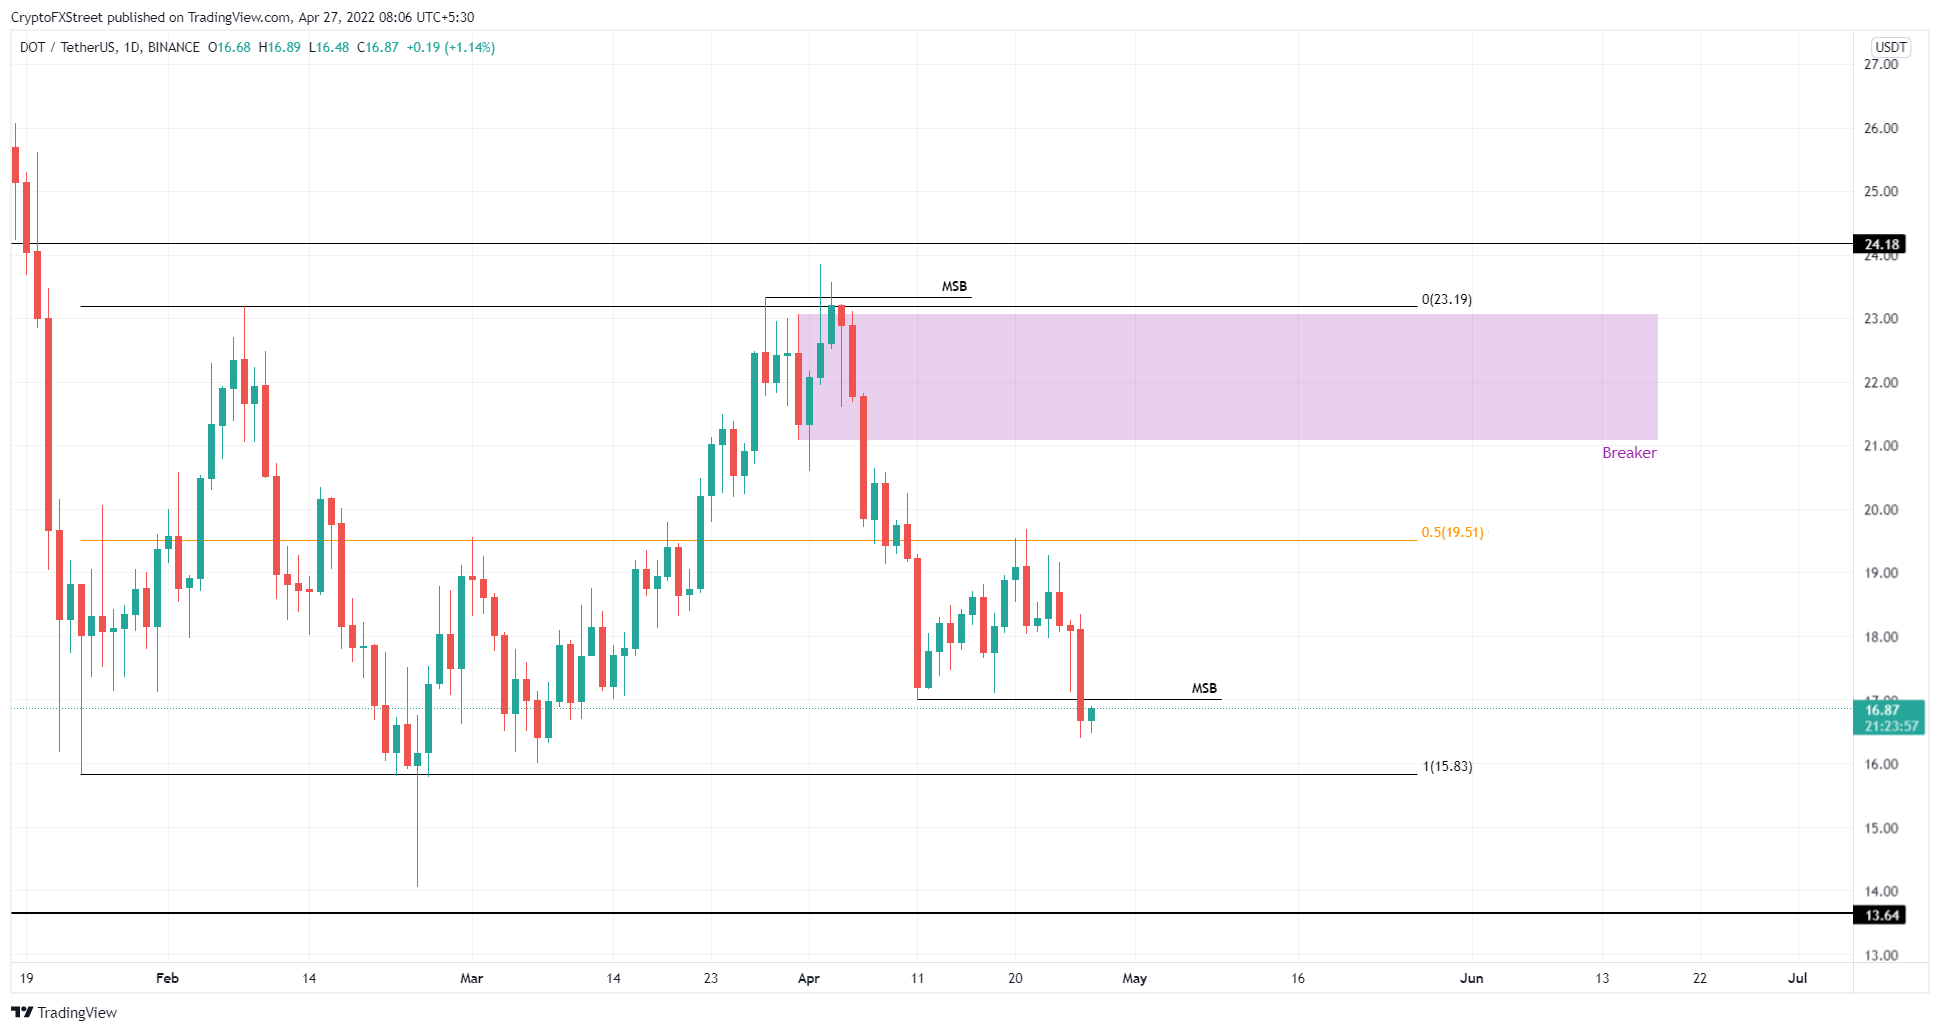
DOT/USDT 1-day chart
While things are looking up for Polkadot price, a daily candlestick close below $15.83 will invalidate the bullish thesis by producing a lower low. In such a case, DOT could crash lower and retest the $13.64 support level.
Author

Akash Girimath
FXStreet
Akash Girimath is a Mechanical Engineer interested in the chaos of the financial markets. Trying to make sense of this convoluted yet fascinating space, he switched his engineering job to become a crypto reporter and analyst.



