Failed attempts at bull rally could crash Polkadot price to this level
- Polkadot price is at a make or break point as it trades under a resistance cluster around $16.
- Investors can expect a 15% crash if DOT bulls fail to overcome the aforementioned hurdle.
- A daily candlestick close above $23.15 will invalidate the bearish thesis.

Polkadot price is at a junction where a failure to breach through significant hurdles will result in a corrective phase. On the other hand, a swift recovery above these levels could set a base for impressive gains.
Polkadot price needs to step up its game
Polkadot price created a range that extends from $15.83 and $23.15 which it has been trading inside since it formed on February 8. After a quick deviation below the swing low at $15.83, DOT rallied roughly 69% and set a swing high at $23.85.
This upswing soon hit a peak of euphoria that caused investors to book profits, leading to a corrective wave that pushed it down by 28%. The retracement also pushed it below the 50% retracement level at $19.49.
The last attempt at an uptrend pushed Polkadot price by 15% where it pierced the midpoint and the 50-day, 100-day Simple Moving Averages (SMAs) but failed to produce a decisive close above these hurdles at $19.62. As a result, DOT faced immense rejection causing an 8% pullback to where it currently trades - $18.30.
If the buyers fail to move above $19.62, the rejection is likely going to push Polkadot price lower to retest the range low at $15.83. In a highly bearish case, DOT could extend lower and retest $13.64.
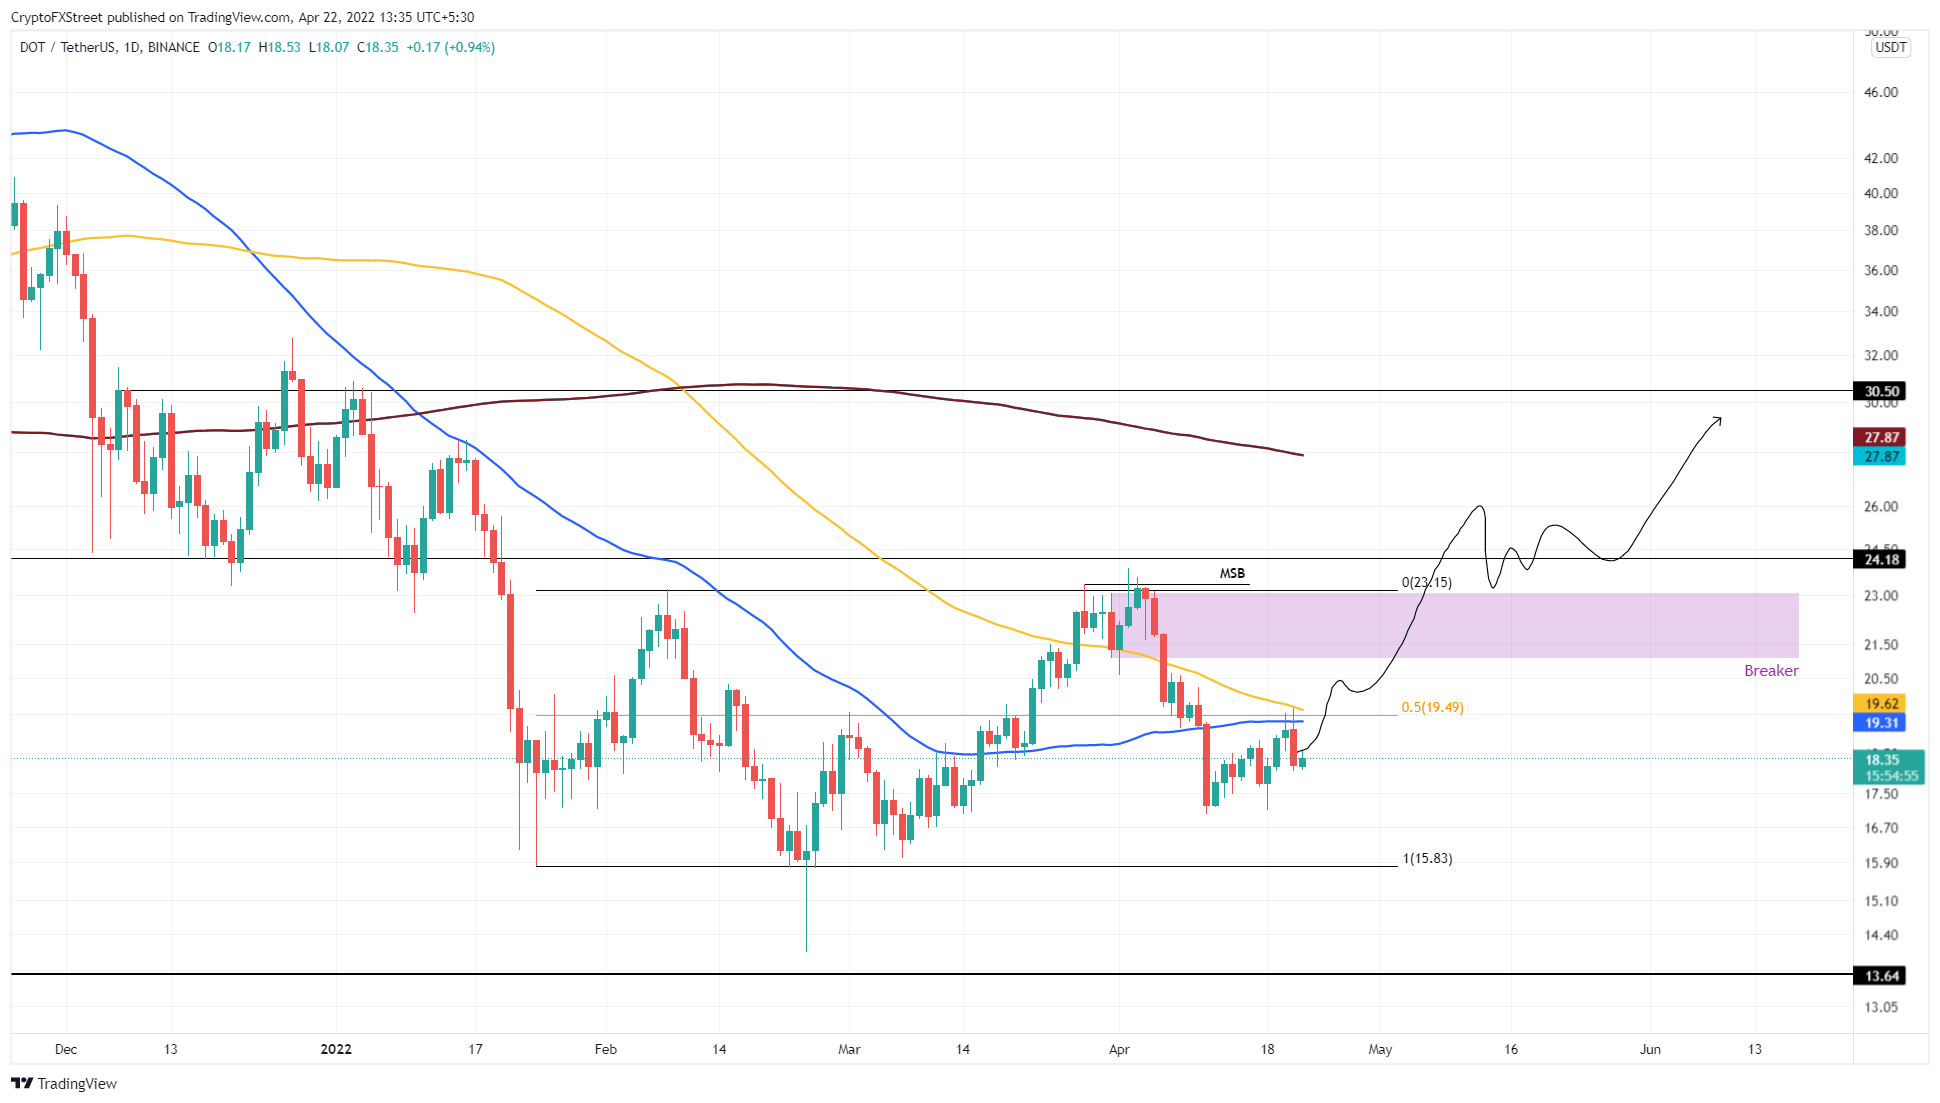
DOT/USDT 1-day chart
While things are looking bearish for Polkadot price, a daily candlestick close above $23.15 will invalidate the bearish thesis. In such a case, DOT will have the chance to rally and retest the $24.18 and $30.50 barriers.
Author

Akash Girimath
FXStreet
Akash Girimath is a Mechanical Engineer interested in the chaos of the financial markets. Trying to make sense of this convoluted yet fascinating space, he switched his engineering job to become a crypto reporter and analyst.


