Why all eyes are on the Shiba Inu price this weekend pt.2
- Shiba Inu price points to one more sharp ascension. A weekend rally could occur.
- SHIB price has an alternative bullish count in the cards based on newfound technicals.
- Multiple trade setups can still be forecasted when reviewing this thesis properly. Traders should beware of the multiple scenarios at play over the weekend.

Shiba Inu is due for an explosive move. The technicals suggest a sharp move targeting $0.00001400 could occur followed by a steep decline.
Shiba Inu Price could get volatile.
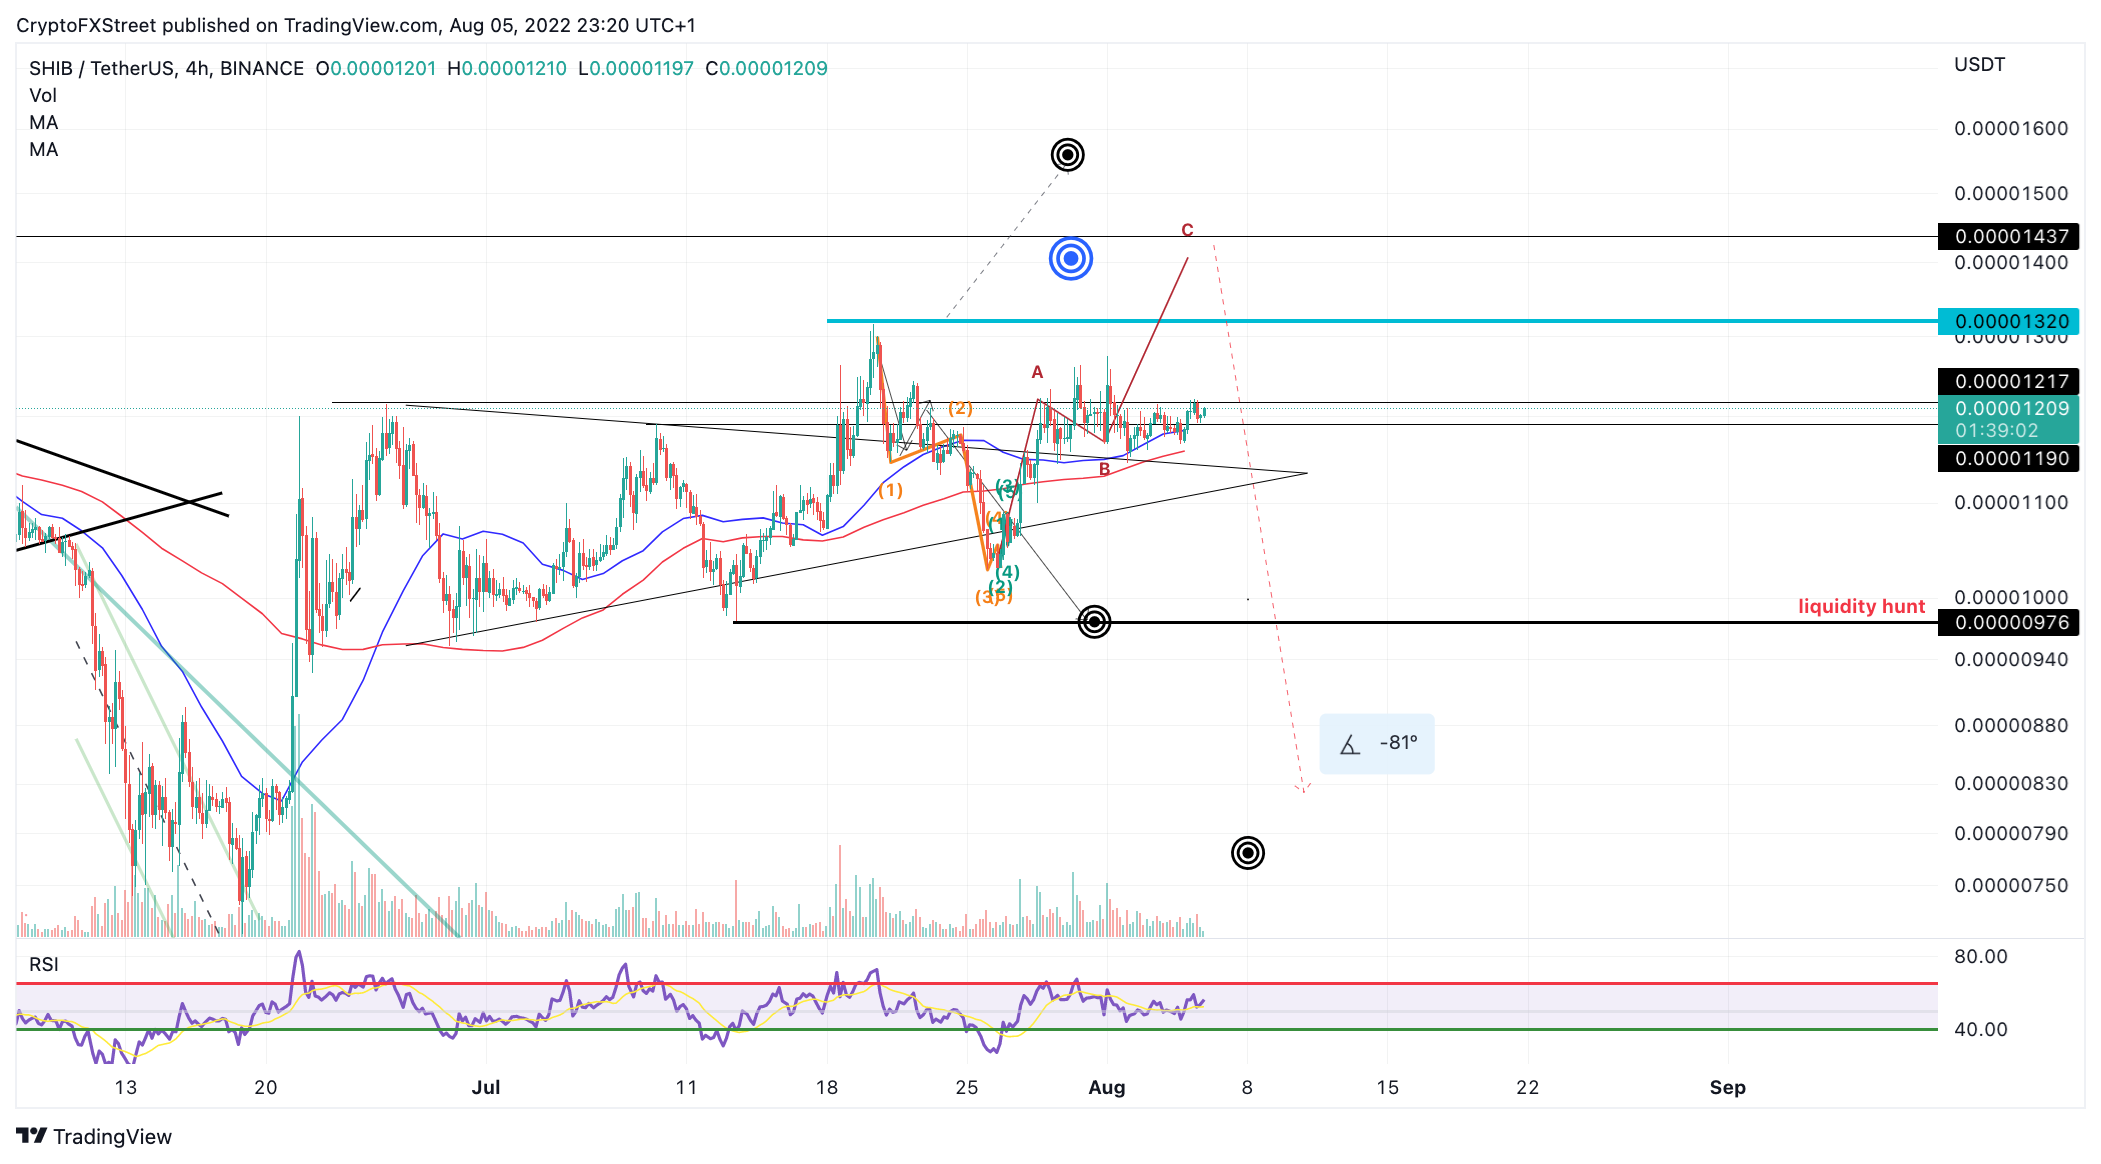
Shiba Inu price shows subtle signs to validate a recently established bullish count. The new found higher high at $0.00001217 could be early evidence of a commmencing price hike towards $0.000014000. Traders should begin setting alerts and forecastiong a trading plan as the SHIBA price coiuld witness extreme volatility likely to induce a FOMO-style price chase. A second attempt at the $0.00001220 level could be the catalyst bullish traders are looking for. Invallidation of the sudden bullish rally would be a break below $0.00001100.
Shiba Inu Recap
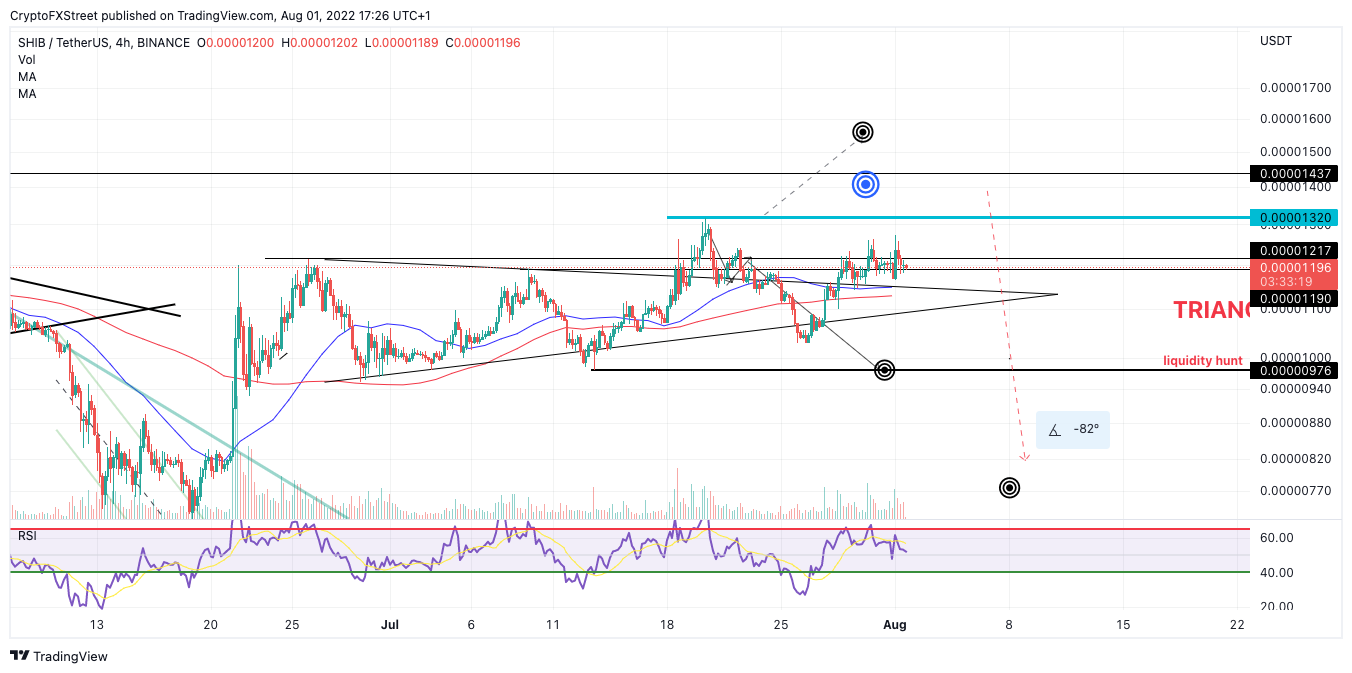
Shiba Inu price had been coiling in a very bullish triangular consolidation this summer. Bullish targets were expected to reach $0.00001700.
Shiba Inu’s failure to display bullish price action prompted ideas of a smart money trap in play. During mid-July, a bearish forecast was issued targeting the $0.00000975 liquidity level.
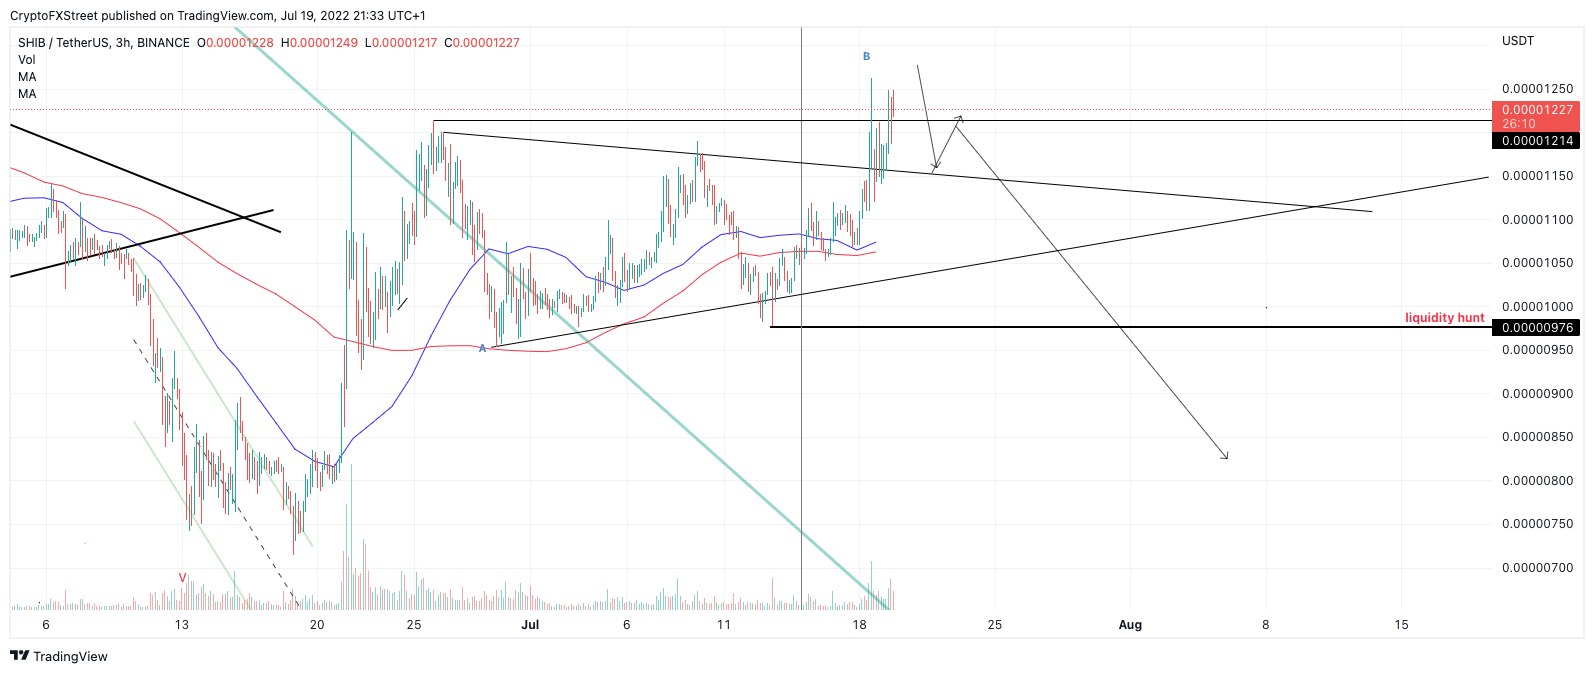
Shiba Ultimate Bear Trap Thesis
Shiba Inu price fell 27% amidst the most recent bearish forecast issued last week to a low at $0.00001033. The notorious dog coin fell 5% short of reaching the targeted $0.00000975 liquidy level and has since retraced nearly 80% of the forecasted decline back above the initial triangular trendline. The price is inducing justifiable confusion amongst crypto traders.

SHIB/USDT 4-Hour Chart
Shiba Inu price is due for a move
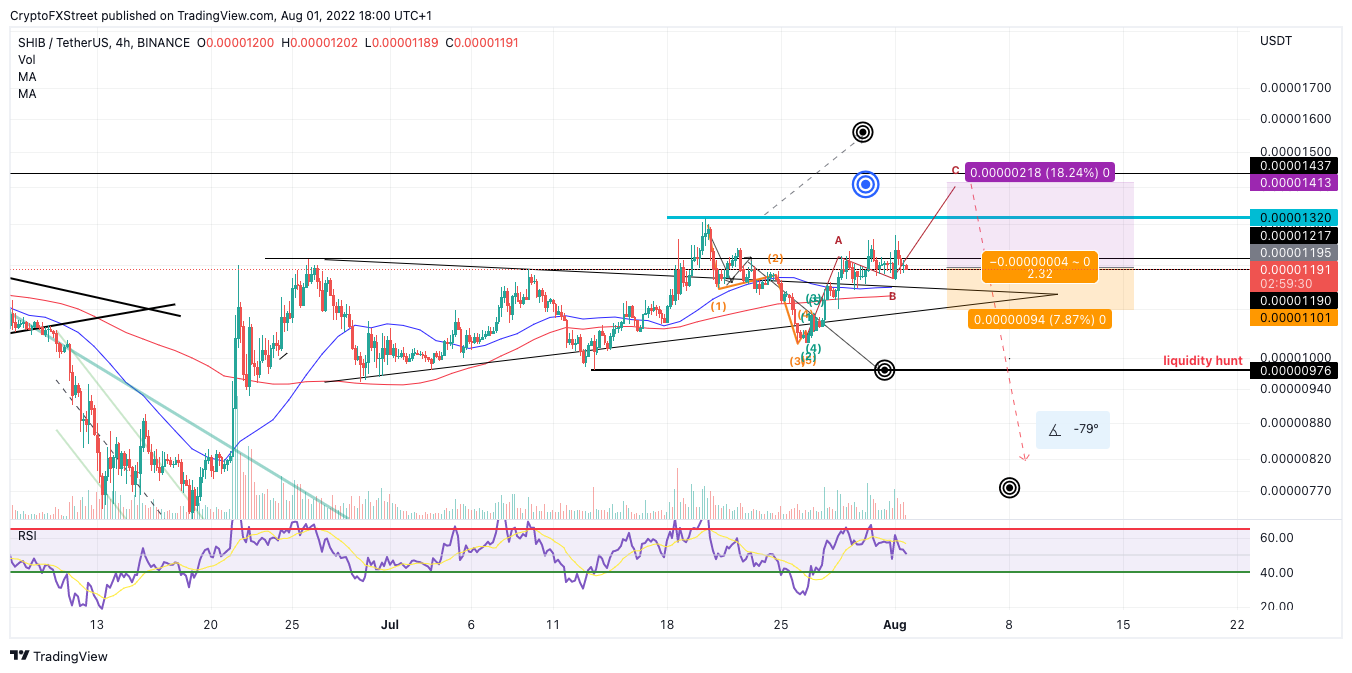
A new scenario is now on the cards, which targets new highs at $0.000014000. A breach above $0.00001270 should be the catalyst to induce such a move. However, traders should be careful as a liquidity hunt could begin promptly after the new summer highs are accomplished with bearish targets in the $0.00000770 levels.
SHIB/USDT 4-Hour Chart
It is also worth noting that a breach below $0.00001100 could induce a sell off towards the $0.00000970 levels in the short term though the technicals do suggest higher targets could occur first.
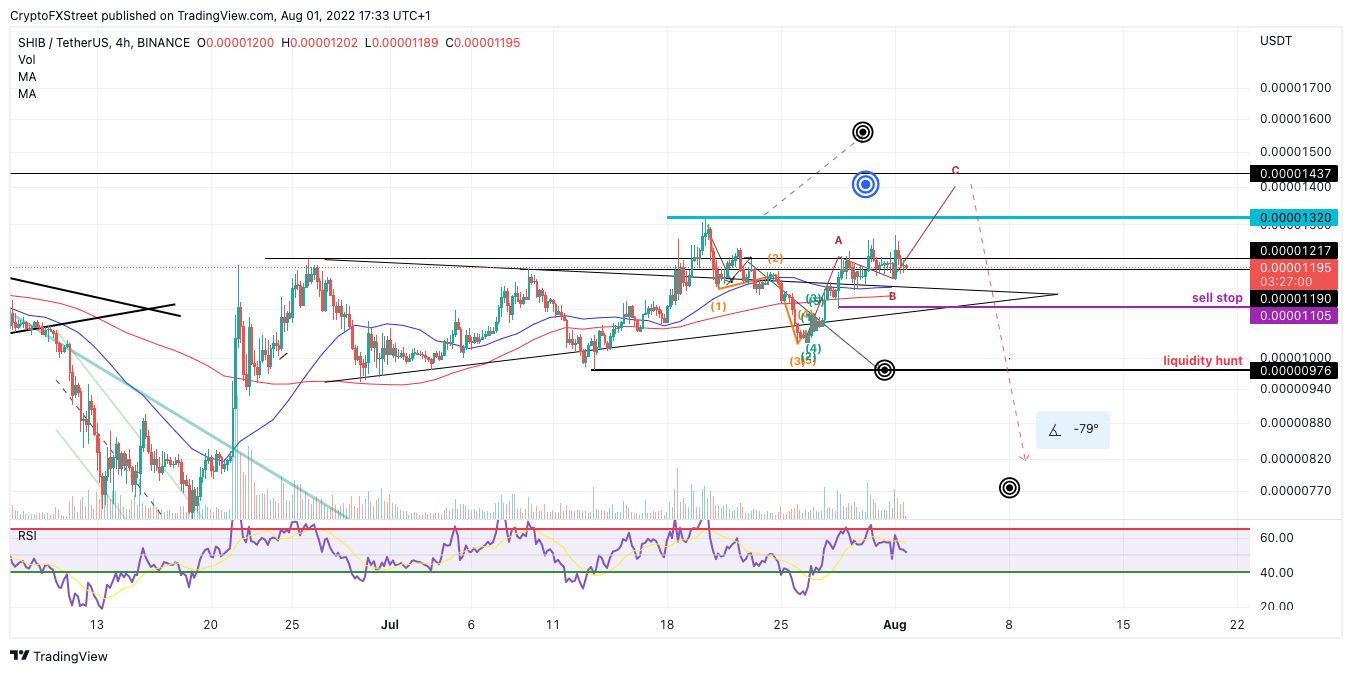
SHIB/USDT Sell-Off Catalyst
Multiple trade setups can be forecasted when reviewing this thesis properly. Traders should beware of the multiple scenarios at play.
In the following video, our analysts deep dive into the price action of Shiba Inu, analyzing key levels of interest in the market. -FXStreet Team
Author

Tony M.
FXStreet Contributor
Tony Montpeirous began investing in cryptocurrencies in 2017. His trading style incorporates Elliot Wave, Auction Market Theory, Fibonacci and price action as the cornerstone of his technical analysis.



