Whose data should investors trust when analyzing the Bitcoin price?
- Bitcoin price volume is vastly different according to the exchange.
- BTC price declined 15% over the weekend.
- Bitcoin price: A sweep-the-lows event remains on the cards.

Richard Wycoff once said, "The Law of Supply and Demand never fails and is the only safe guide under extraordinary market conditions." Following the late forefather of Technical Analysis, this article aims to create awareness about Bitcoin's volume data and the need for more transparency in the cryptocurrency ecosystem.
Bitcoin price shows chart discrepancies
Bitcoin price auctions at $21,392 in a sideways manner following the weekend's 15% decline. Investors should be aware that diverging chart data is a factor in the game of crypto, which makes being a crypto investor evermore challenging. Although many enthusiasts would like to believe in a strong bounce from the current levels, the discrepancies suggest a sweep-the-lows event should not be ruled off the table either.

BTC/USDT Binance
On the other hand, the volume profile indicator on the KUCoin exchange narrates an entirely different pattern. Kucoin's data would suggest the bears are fully in control and the current uptrend is merely a sucker's rally underway.
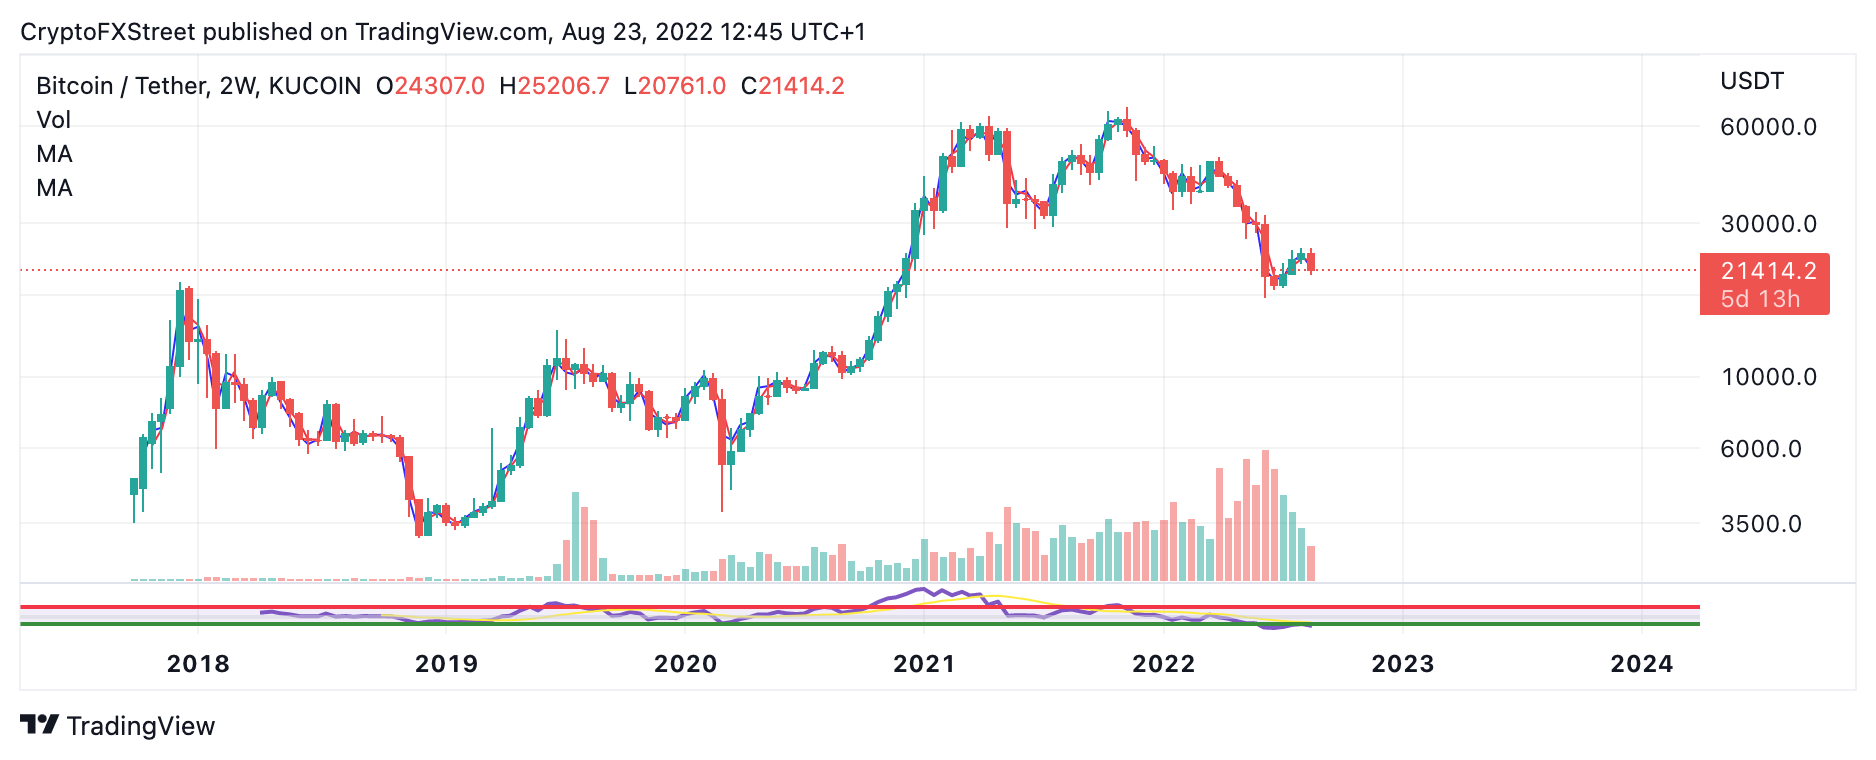
BTC/USDT Kucoin
Santiment's Volume Profile Indicator is an on-chain analysis tool that can be used for chart discrepancies mentioned above. The indicator shows more of a balanced outlook compared to the two exchanges, but still shows relatively low volume for August compared to previous bull-run catalysts.
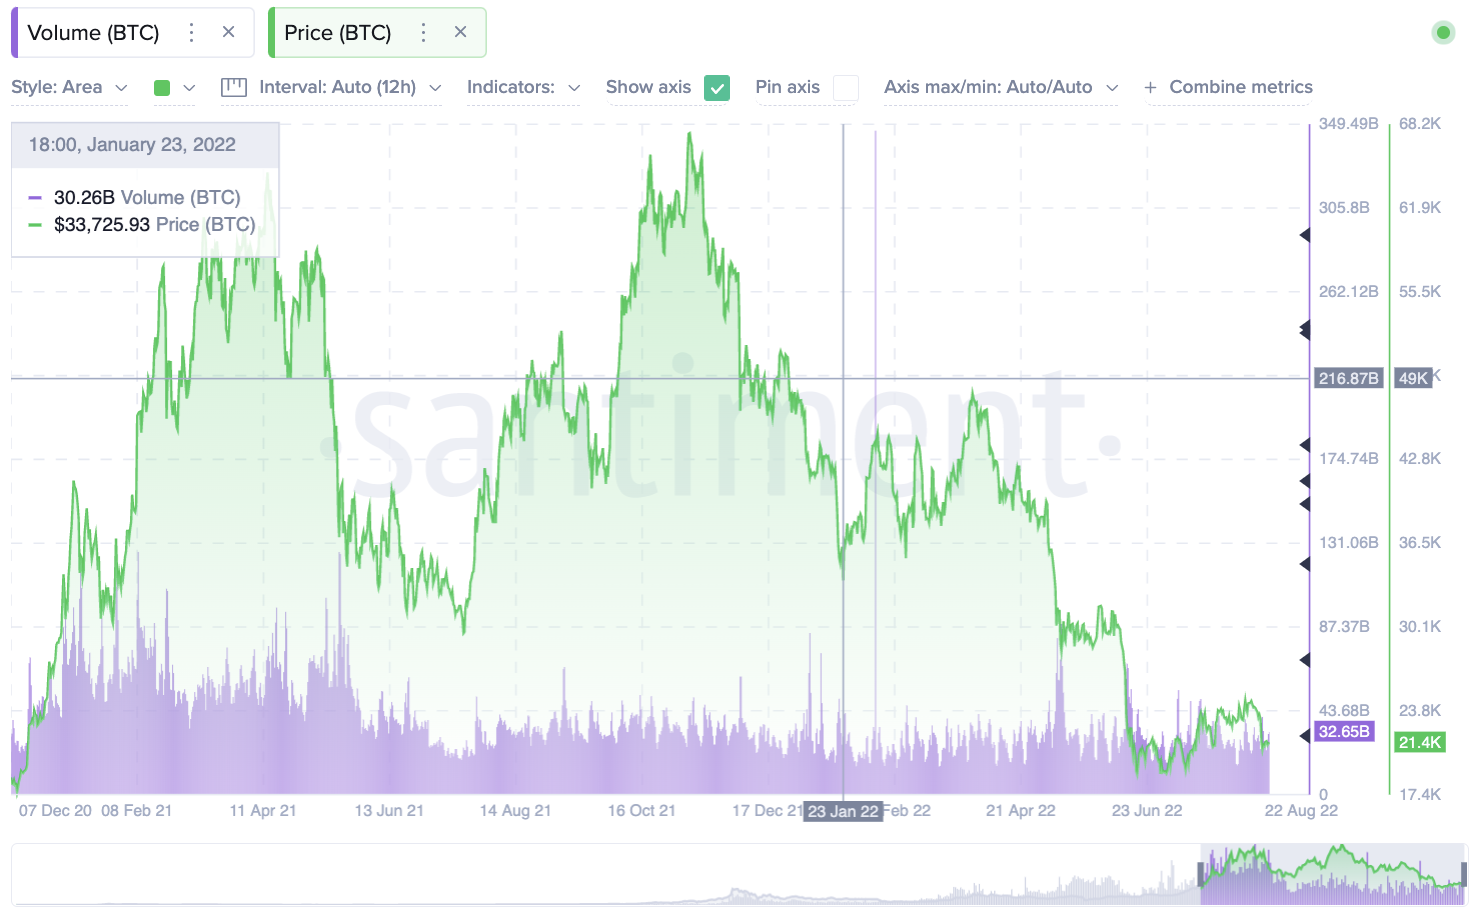
Santiment Price & Volume Profile Indicators
When combined, relying solely on one exchange's data can leave investors with a blind spot. Perhaps investors may want to consider using third-party exchanges like Santiment and Glassnote to get a broader picture of what is happening underneath the hood.
In the following video, our analysts deep dive into the price action of Bitcoin, analyzing key levels of interest in the market. -FXStreet Team
Author

Tony M.
FXStreet Contributor
Tony Montpeirous began investing in cryptocurrencies in 2017. His trading style incorporates Elliot Wave, Auction Market Theory, Fibonacci and price action as the cornerstone of his technical analysis.