Where Bitcoin, Ethereum prices are headed as correlation with S&P 500 declines
- S&P 500 took another nosedive this week, driving Bitcoin, Ethereum and digital asset prices down.
- Analysts have identified signs of a break in the tight correlation between Bitcoin and S&P 500.
- Analysts believe Bitcoin price could remain sandwiched between two long-term moving averages at $18,846 and $22,836.

A mysterious Bitcoin whale moved a large volume of BTC that was dormant for a decade. Amidst the breaking correlation between Bitcoin and S&P 500, analysts are bearish on BTC price.
Also read: Polkadot eyes double-digit gains, announces 1000x increase in speed
Bitcoin's correlation with S&P 500 on the decline
Analysts at crypto intelligence platform Santiment argue that things were looking up for Bitcoin, Ethereum and cryptocurrencies over the past week. The decline in the S&P 500 drove prices of digital assets lower over the past week, and analysts have identified signs of a break in the tight correlation between the two sectors.
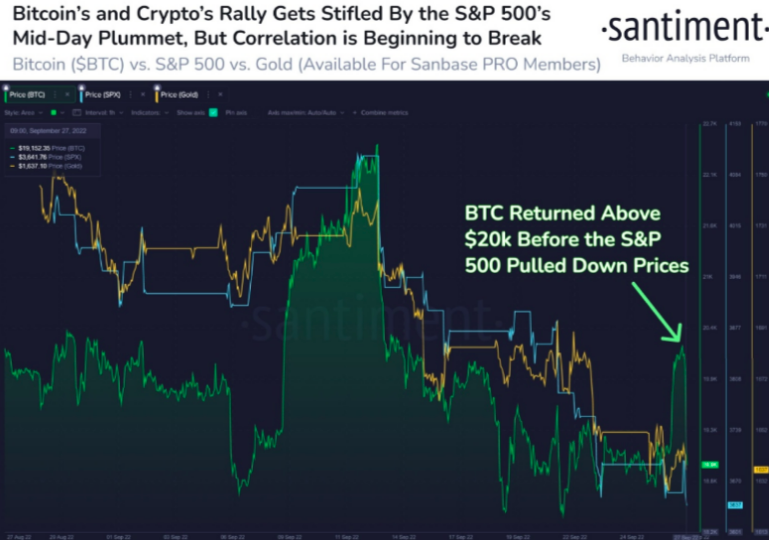
Bitcoin, Ethereum's correlation with S&P500 on the decline
Bitcoin whales move dormant coins after a decade
A mysterious Bitcoin whale moved a large volume of BTC that was lying dormant for a decade. Based on data from the Bitcoin blockchain, long-term holders are moving BTC held dormant for over a decade during the ongoing bear market. Typically, the movement of large volumes of dormant Bitcoin is associated with a trend reversal in the asset.
In the past week, nearly $10 million in dormant Bitcoin was moved. Philip Swift, the creator of Lookintobitcoin, notes that a movement of 510.65 Bitcoin started in a prolonged bear market.
The asset's cycle low is slightly above the $18,000 level.
Analysts believe Bitcoin price could remain sandwiched between two moving averages
RektCapital, a pseudonymous crypto analyst and trader, argues that Bitcoin has rebounded from green support while not actually touching the 300-day MA. The asset continues to be sandwiched between these two long-term moving averages, 300-day MA at $18,646 and 200-day MA at $22,836.
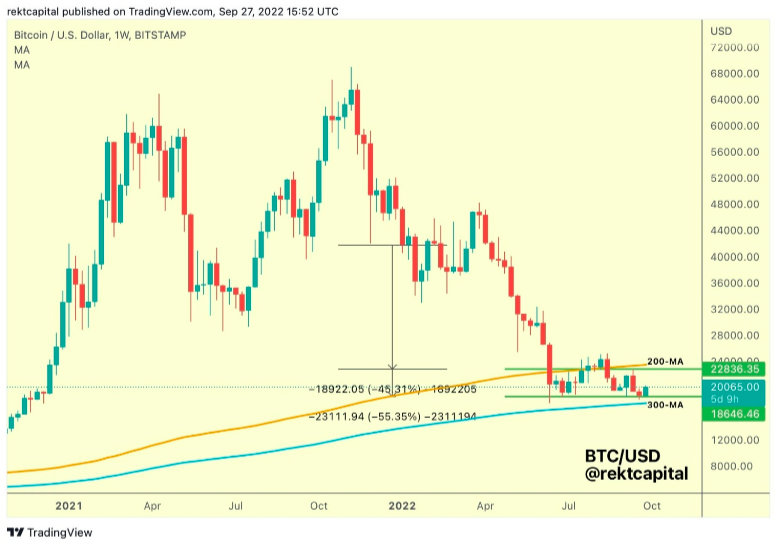
BTC-USD price chart
CryptoCapo, a crypto trader and analyst, remains opposed to the idea of a rally in Bitcoin price. The analyst believes a quick fakeout to $20,500 is likely, however, Bitcoin could witness a correction soon after.
Regarding $BTC and the rest of the market, a quick scam pump to 20500 is likely, but I wouldn't be bullish.
— il Capo Of Crypto (@CryptoCapo_) September 27, 2022
This is just the test
Author

Ekta Mourya
FXStreet
Ekta Mourya has extensive experience in fundamental and on-chain analysis, particularly focused on impact of macroeconomics and central bank policies on cryptocurrencies.




