What will happen to Shiba Inu price and holders after SHIB bears tear through this level?
- Shiba Inu price has undone the $0.0000106 to $0.0000111 demand zone, suggesting a bearish outlook.
- This development invalidates the bullish outlook and indicates a further descent is likely.
- A daily candlestick close above $0.0000121 will invalidate the bearish outlook for SHIB.

Shiba Inu price has successfully invalidated its bullish pennant pattern, suggesting that the bears are in control. Investors can expect a further drop in SHIB if certain significant levels are breached.
Shiba Inu price ready for more losses
Shiba Inu price has undone the gains it saw since July 14 as sellers take control of the meme coin. This development has also triggered a fakeout for the ongoing continuation pattern - the bullish pennant.
This technical formation is made up of a flagpole and a pennant. For SHIB, the 34% explosive move between June 19 and June 25 created the flagpole and the consolidation that ensued in the form of higher lows and lower highs created a pennant.
This pattern forecasts a 34% upswing to $0.0000154, obtained by adding the flagpole’s height to the breakout point at $0.0000116, which took place on July 18. Additionally, SHIB also retested the pennant after breaking out to confirm the ongoing bullish outlook.
After this development, Shiba Inu price climbed 14% but failed to maintain this momentum and allowed bears to take control. As a result, SHIB dropped 20% from its July 20 swing high at $0.0000131.
Moreover, the meme coin has also sliced through the $0.0000106 to $0.0000111 demand zone and is currently headed toward a retest of the $0.0000095 support level. This barrier is the only thing that stands between a 13% crash and a resurgence of a bullish outlook.
Hence, investors should be prepared for a potential retest of the $0.0000082 by the end of the week.
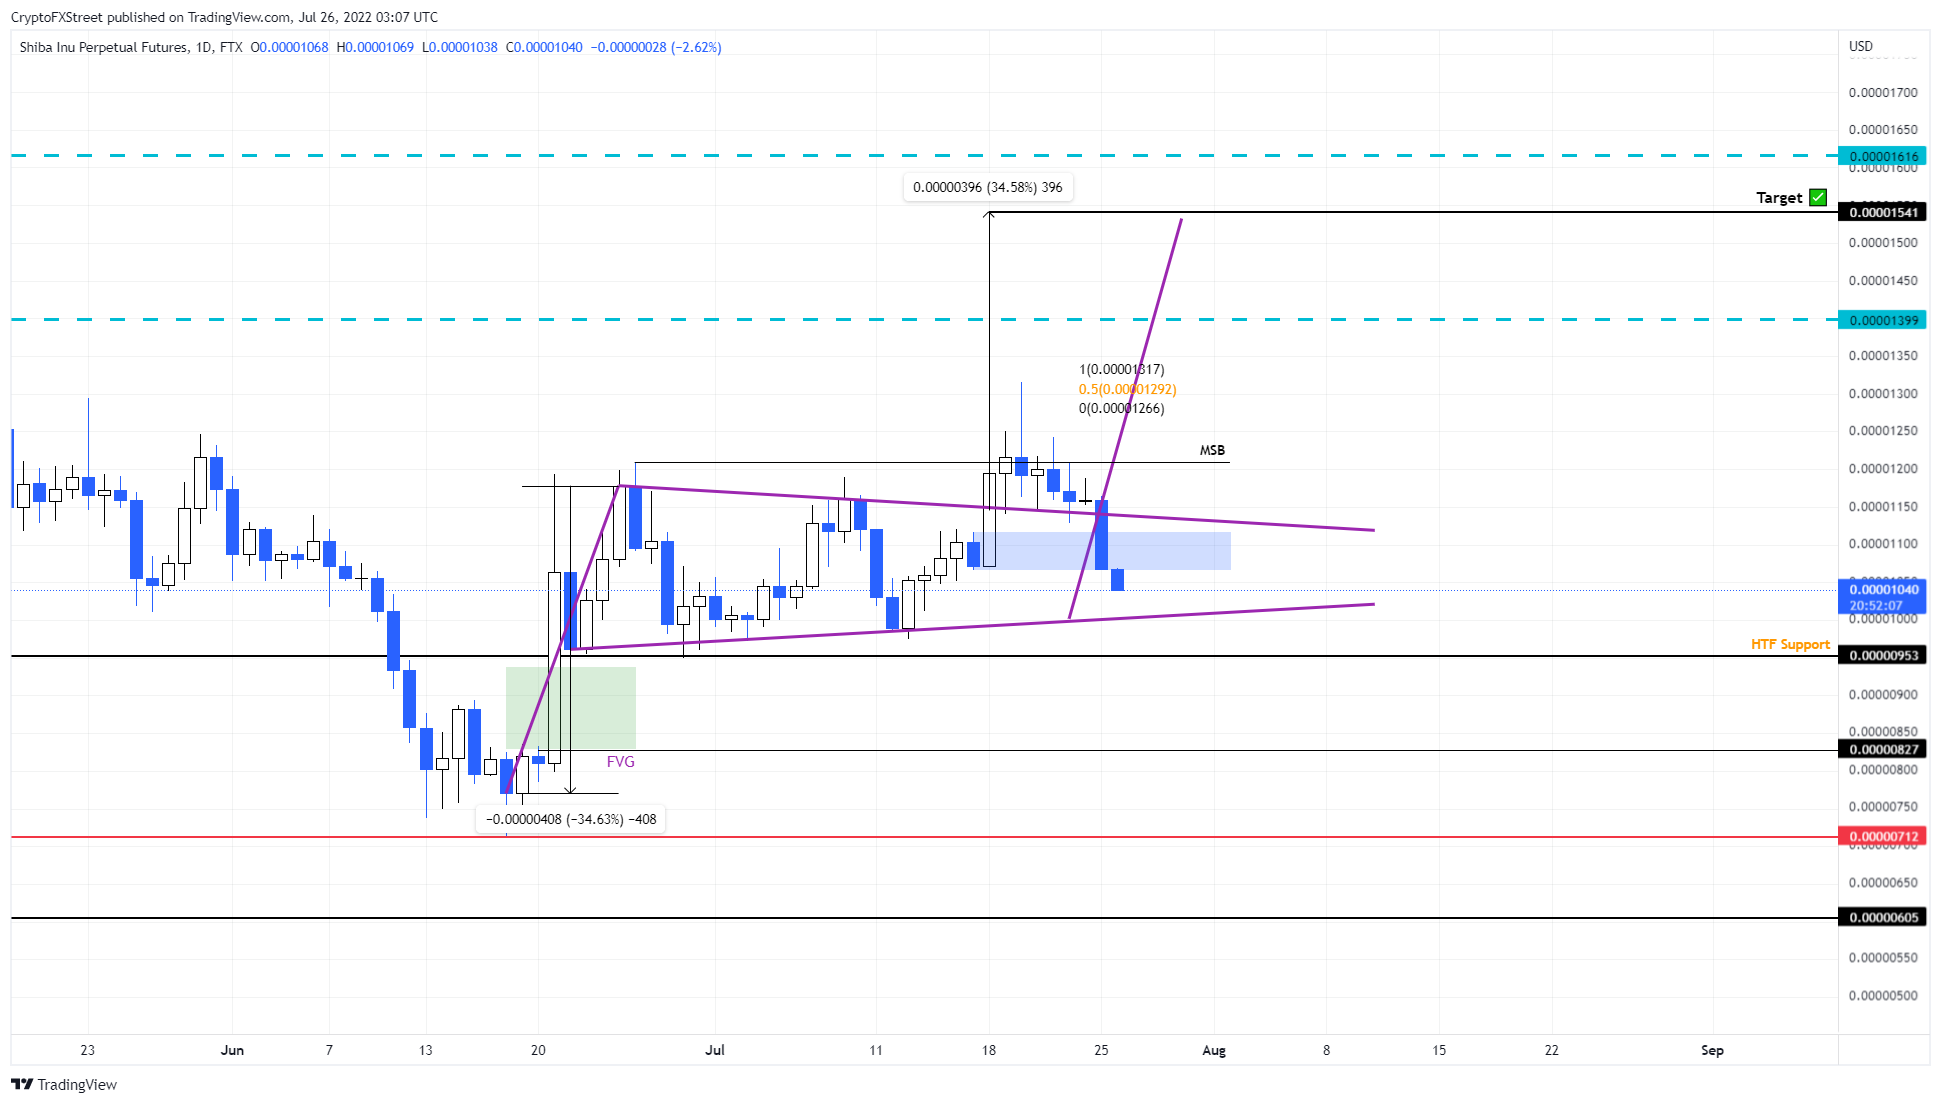
SHIB/USDT 1-day chart
On the other hand, if Shiba Inu price produces a daily candlestick close above the $0.0000121 level, it will produce a higher high and invalidate the bearish thesis. In such a case, SHIB could trigger a rally to the next meaningful resistance level at $0.0000139.
Author

Akash Girimath
FXStreet
Akash Girimath is a Mechanical Engineer interested in the chaos of the financial markets. Trying to make sense of this convoluted yet fascinating space, he switched his engineering job to become a crypto reporter and analyst.



