Shiba Inu Price Prediction: Did breakout bulls get it wrong?

- Shiba Inu price witnessed a 7% decline, which could be the first impulse of a larger 20% decline in the coming days.
- SHIB price failed to find support from the 8-day simple moving average and now hovers above the 21-day moving average.
- Invalidation of the downtrend remains a breach above $0.00001320.
Shiba Inu price shows early evidence of a 20% decline underway. Traders who partook in the July 22 bearish forecast are now in profit.
Shiba Inu price is in profit
Shiba Inu price witnesses bearish rejection to start the final trading week of July. It was mentioned in an earlier forecast this month that the triangle could be a smart money trap. The bulls who partook in the bullish breakout of the triangle are now at a loss and are testing the final level of support before a downward spiral becomes evident. Traders should consider the price action around the current market value as a pivotal fork in the road.
Shiba Inu price currently trades at $0.00001125. A Fibonacci retracement tool surrounding the July 13 swing low at $0.00000974 and the July 20 swing high at $0.00001315 suggests the notorious dog coin has retraced 61.8%. A closing candle in the $0.00001100 zone could be defined as too deep for a bull run. An additional 14% decline could likely take place in the coming days targeting the $0.00000976 swing low.
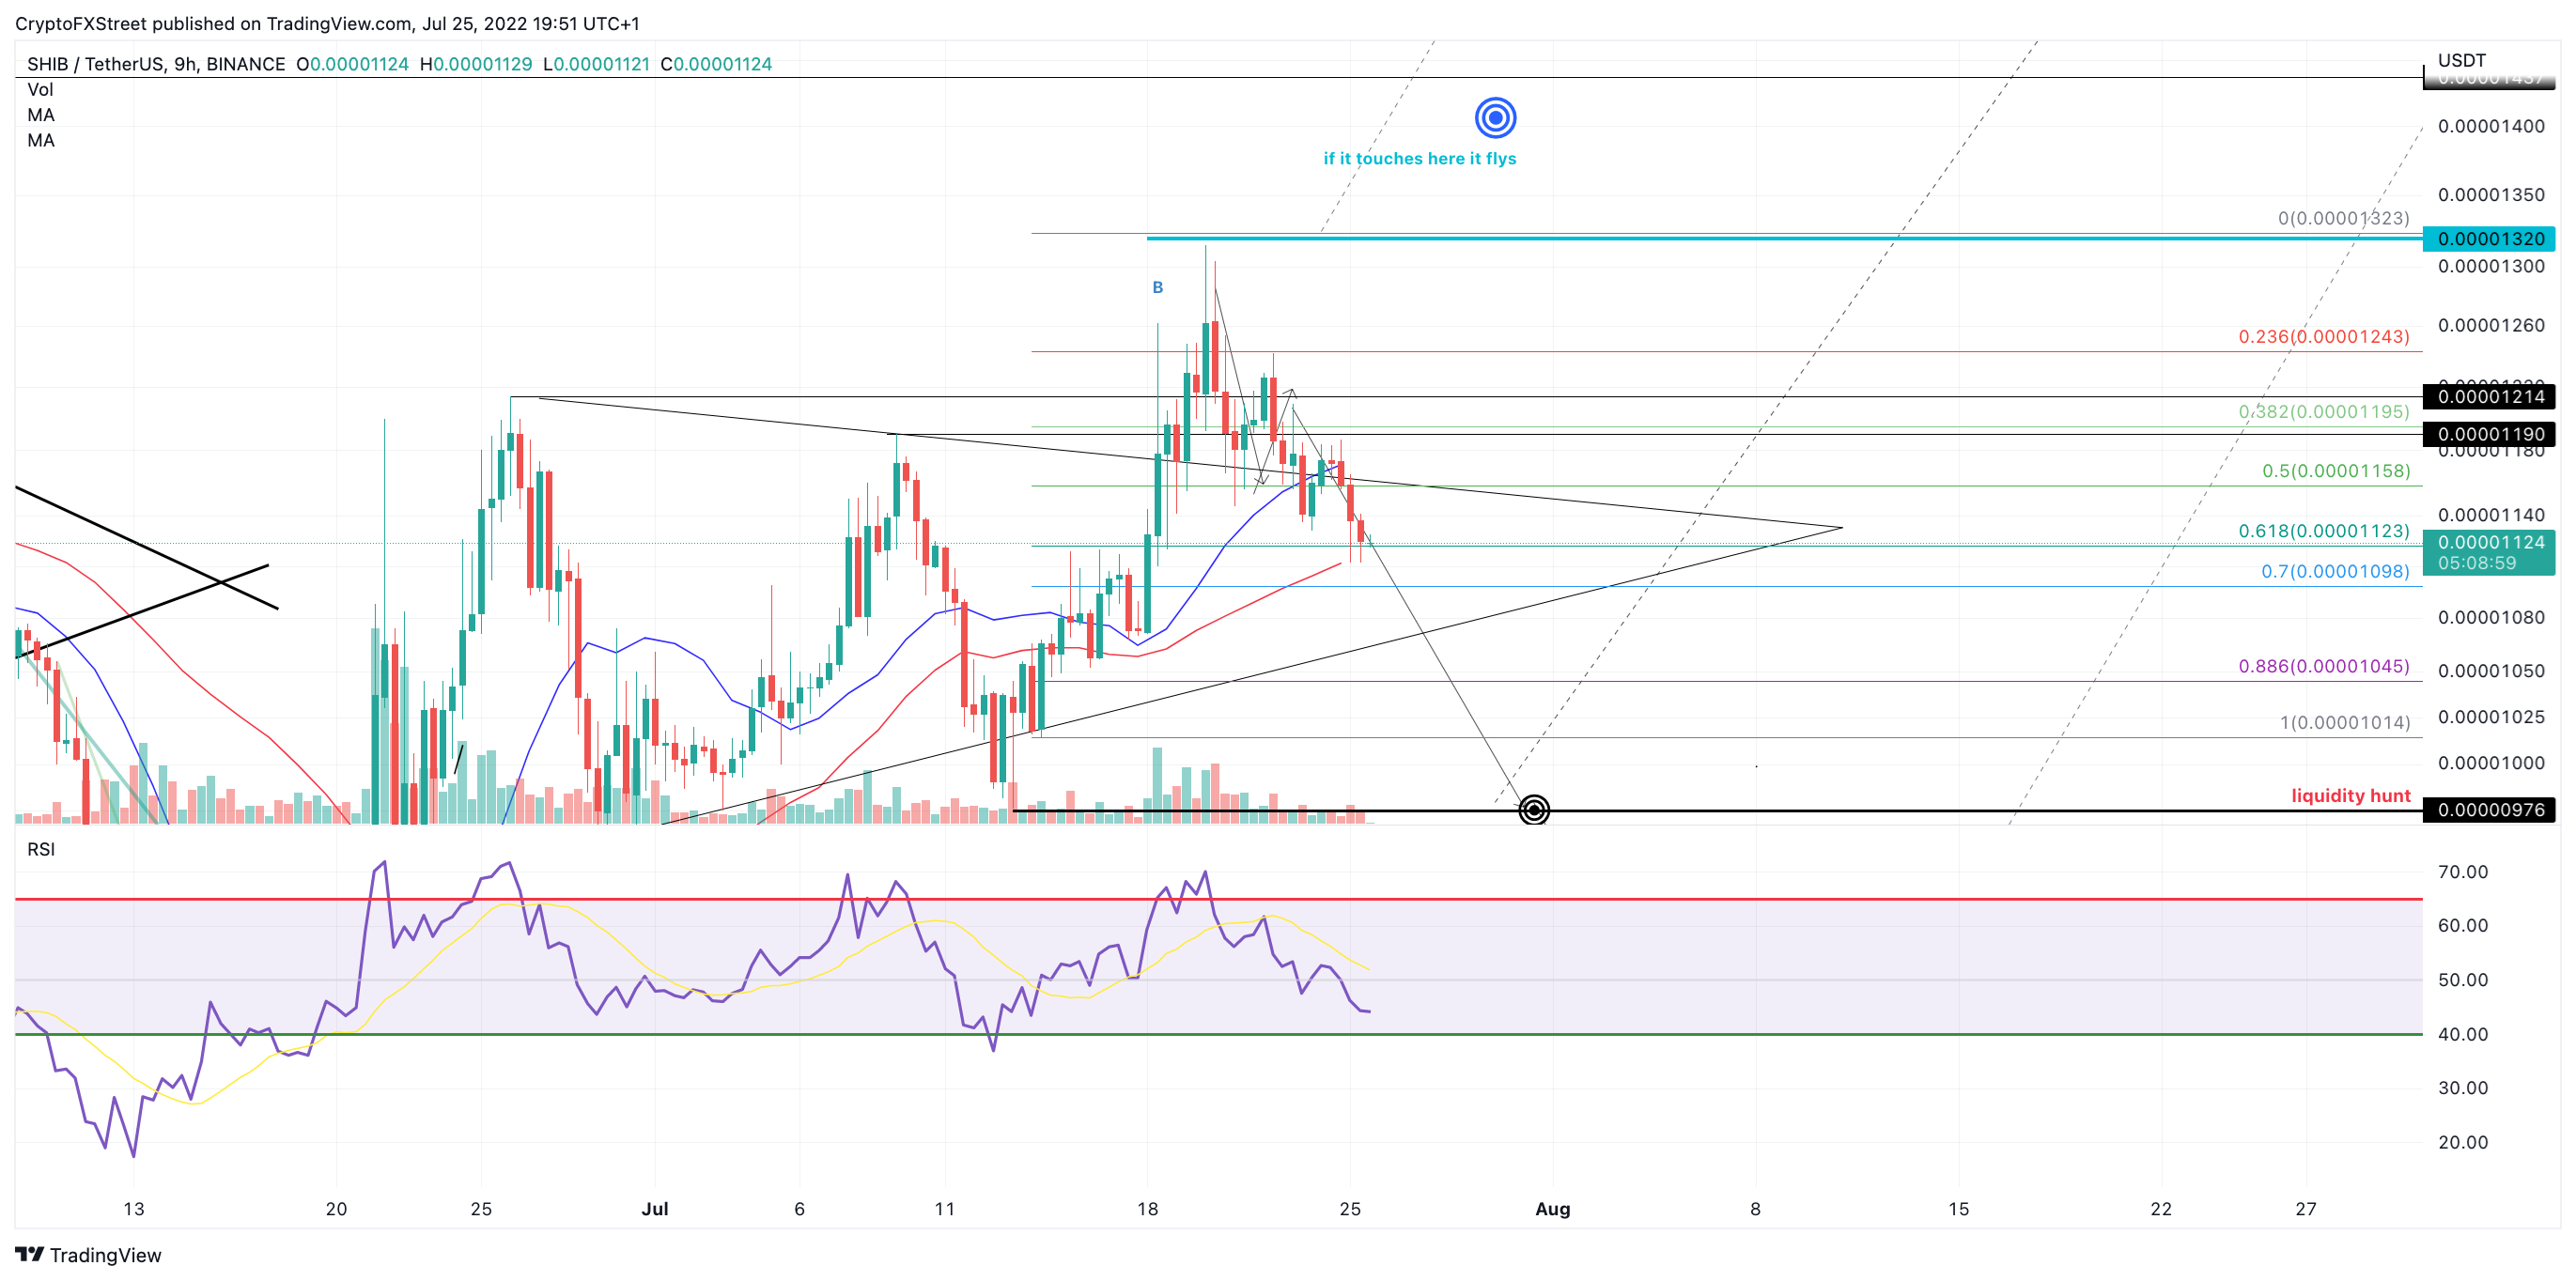
SHIB/USDT 9-Hour Chart.
At current time, a 21-day SMA hovers just below the current SHIB price, which should be viewed as the final level of support. A close below it on larger time frames should be enough to prompt a 15% decline in the coming days.
Still, a safe invalidation of the downtrend remains a breach above $0.00001320. If the bulls conquer the invalidation level they should be able to induce a rally targeting $0.00001400, resulting in a 25% increase from the current Shiba Inu price.
In the following video, our analysts deep dive into the price action of Shiba Inu, analyzing key levels of interest in the market. -FXStreet Team
Author

Tony M.
FXStreet Contributor
Tony Montpeirous began investing in cryptocurrencies in 2017. His trading style incorporates Elliot Wave, Auction Market Theory, Fibonacci and price action as the cornerstone of his technical analysis.



