Shiba Inu price discards bullish outlook as bears seize control, here’s what’s next for SHIB
- Shiba Inu price shows a lack of bullish momentum that has pushed it back inside the pennant.
- The $0.0000106 to $0.0000111 demand zone is the only valid support that stands between a 34% upswing and a 22% crash.
- A daily candlestick close below $0.0000095 will trigger a nosedive to $0.0000082.
Shiba Inu price has been a relatively bad altcoin to trade. The meme coin has pushed its users from euphoria to greed in late June and indecisiveness throughout July with a tiny bit of hope as it breached a bullish continuation pattern.
Now, the so-called “Dogecoin-killer” seems to be on a path to discarding this optimistic outlook, hinting at a potentially bearish scenario.
Shiba Inu price and its last line of defense
Shiba Inu price breached a bullish pennant, aka a continuation pattern, on July 18 as it rallied 22% in under 48 hours. This technical formation is made up of a flagpole and a pennant.
For SHIB, the 34% explosive move between June 19 and June 25 created the flagpole and the consolidation that ensued in the form of higher lows and lower highs created a pennant.
This pattern forecasts a 34% upswing to $0.0000154, obtained by adding the flagpole’s height to the breakout point at $0.0000116. After a clean breakout on July 18 at $0.0000116, SHIB also provided a clean retest of the pennant, further confirming its bullish outlook.
As a result, Shiba Inu price climbed 14% after producing a breakout. However, the bearish forces took control, leading to a premature reversal of this move that has now pierced the pennant’s body.
Technically, this move already decreases the chances of a breakout reaching its destination; regardless, there is still a chance.
Since Shiba Inu price currently retests the $0.0000106 to $0.0000111 demand zone, it is the altcoin’s last hope of saving the bullish outlook. Assuming SHIB bulls step in and defend this level, the buyers will have another chance to trigger a run-up to the forecasted target at $0.0000154.
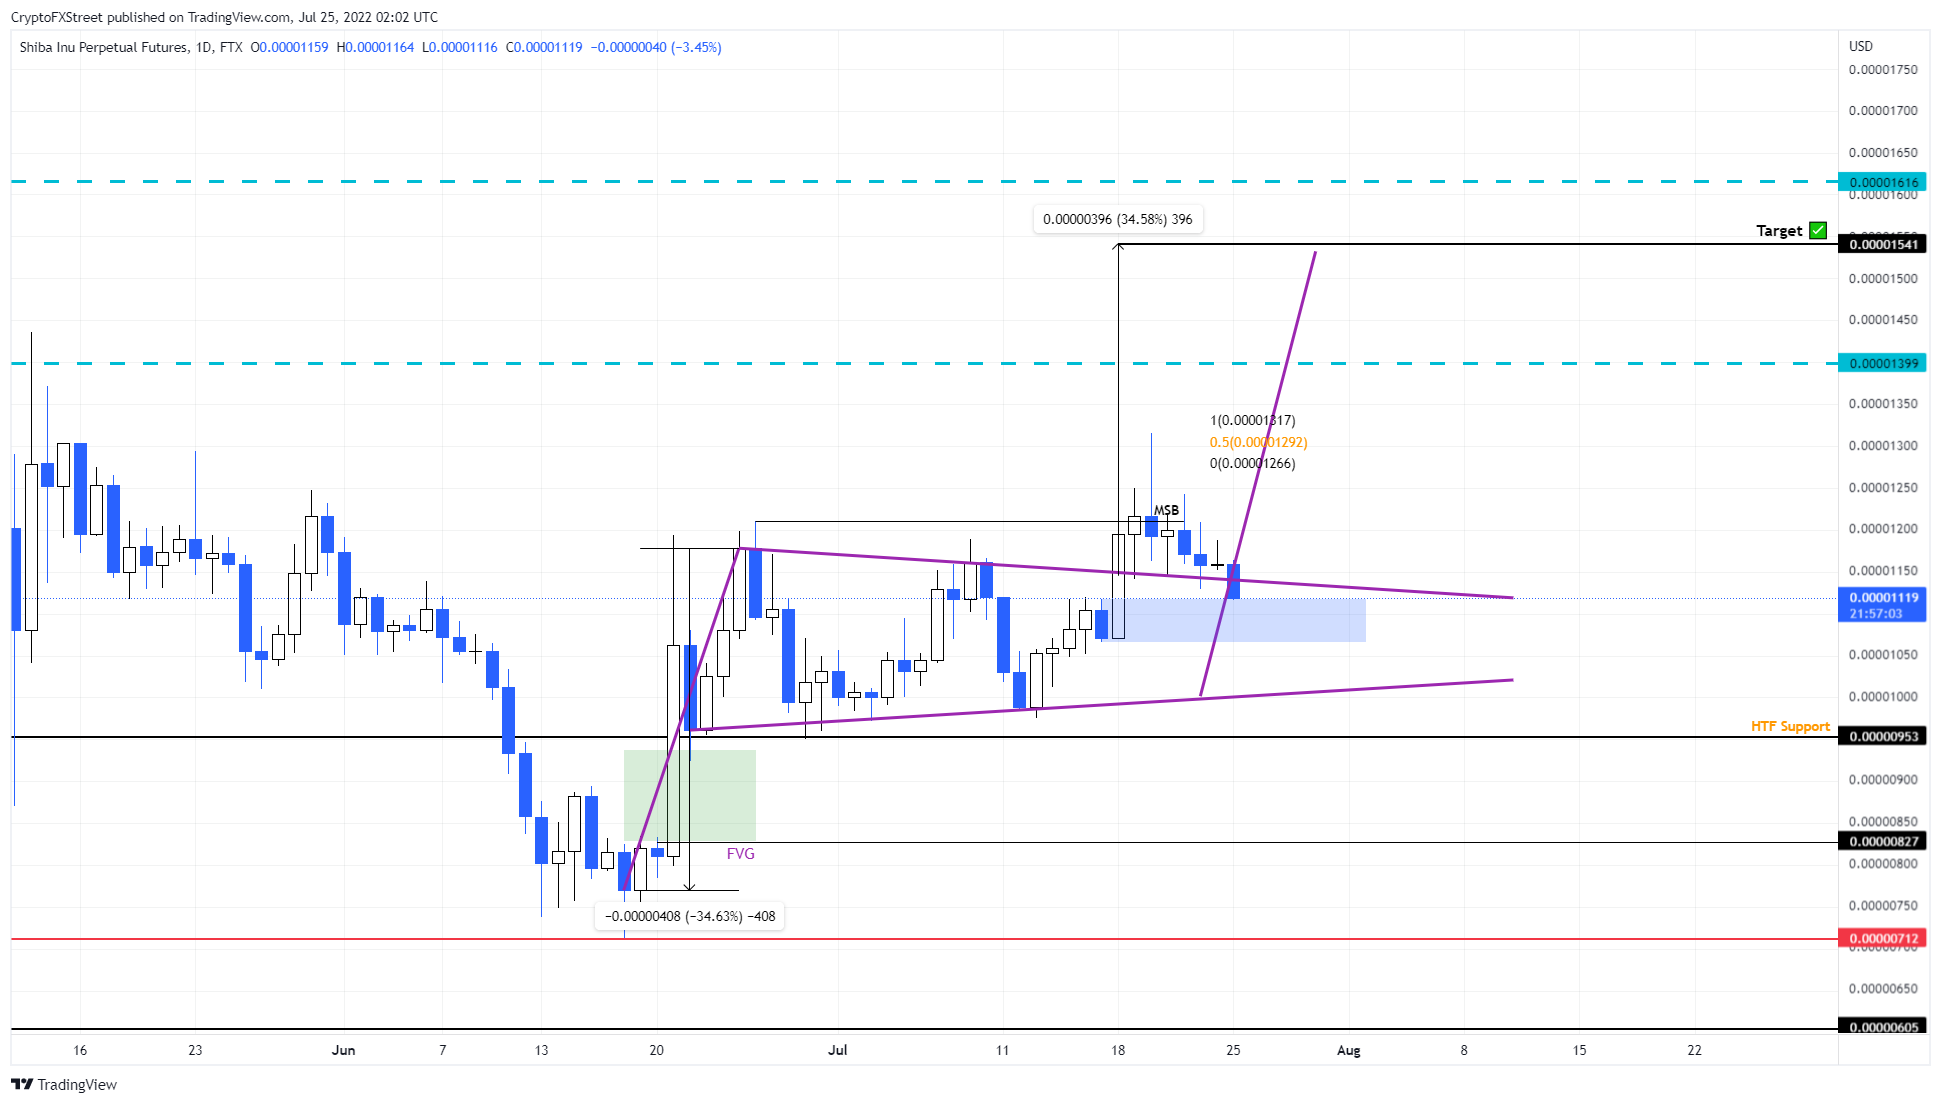
SHIB/USDT 1-day chart
On the other hand, if Shiba Inu price fails to hold above the $0.0000106 to $0.0000111 demand zone, it will indicate a weakness among buyers. In such a case, a daily candlestick close below the $0.0000106 level will invalidate the bullish thesis and trigger a move to $0.0000095.
A breakdown of this level will further trigger a 22% crash to $0.0000083.
Author

Akash Girimath
FXStreet
Akash Girimath is a Mechanical Engineer interested in the chaos of the financial markets. Trying to make sense of this convoluted yet fascinating space, he switched his engineering job to become a crypto reporter and analyst.


