What this make-or-break point means for XRP price
- XRP price created a double bottom at $0.326 and rallied 16% over the last 48 hours
- While this move is bullish, it faces the $0.381 hurdle; a failure to overcome it could result in a correction.
- A daily candlestick close below $0.381 will invalidate the bearish thesis for Ripple.

XRP price showed strength as it bounced off a stable support level and triggered a run-up over the last two days. As bullish as this may seem, investors need to stay cautious as the rally could either exhaust and retrace or breakout and extend.
XRP price at an inflection point
XRP price breached below the declining trend line, suggesting that the buyers were done. However, after forming a double bottom at $0.326, Ripple bulls came back with a vengeance. As a result, the altcoin triggered a 16% ascent in less than 72 hours.
This impressive rally currently faces a decision that will decide its next course of action. A swift move above $0.381 flipping it into a support floor or a retracement that revisits the $0.340 barrier.
Judging by the market sentiment, a retracement seems plausible, especially if the Bitcoin price takes a U-turn. In such a case, the XRP price has the $0.340 support level to fall back on. In the event that this barrier is broken, the market makers could easily drag the remittance token to sweep the $0.326 level.
Due to the formation of a double bottom pattern, there is a ton of buy-stop liquidity below this level, making it an obvious level to sweep from a market makers’ perspective.
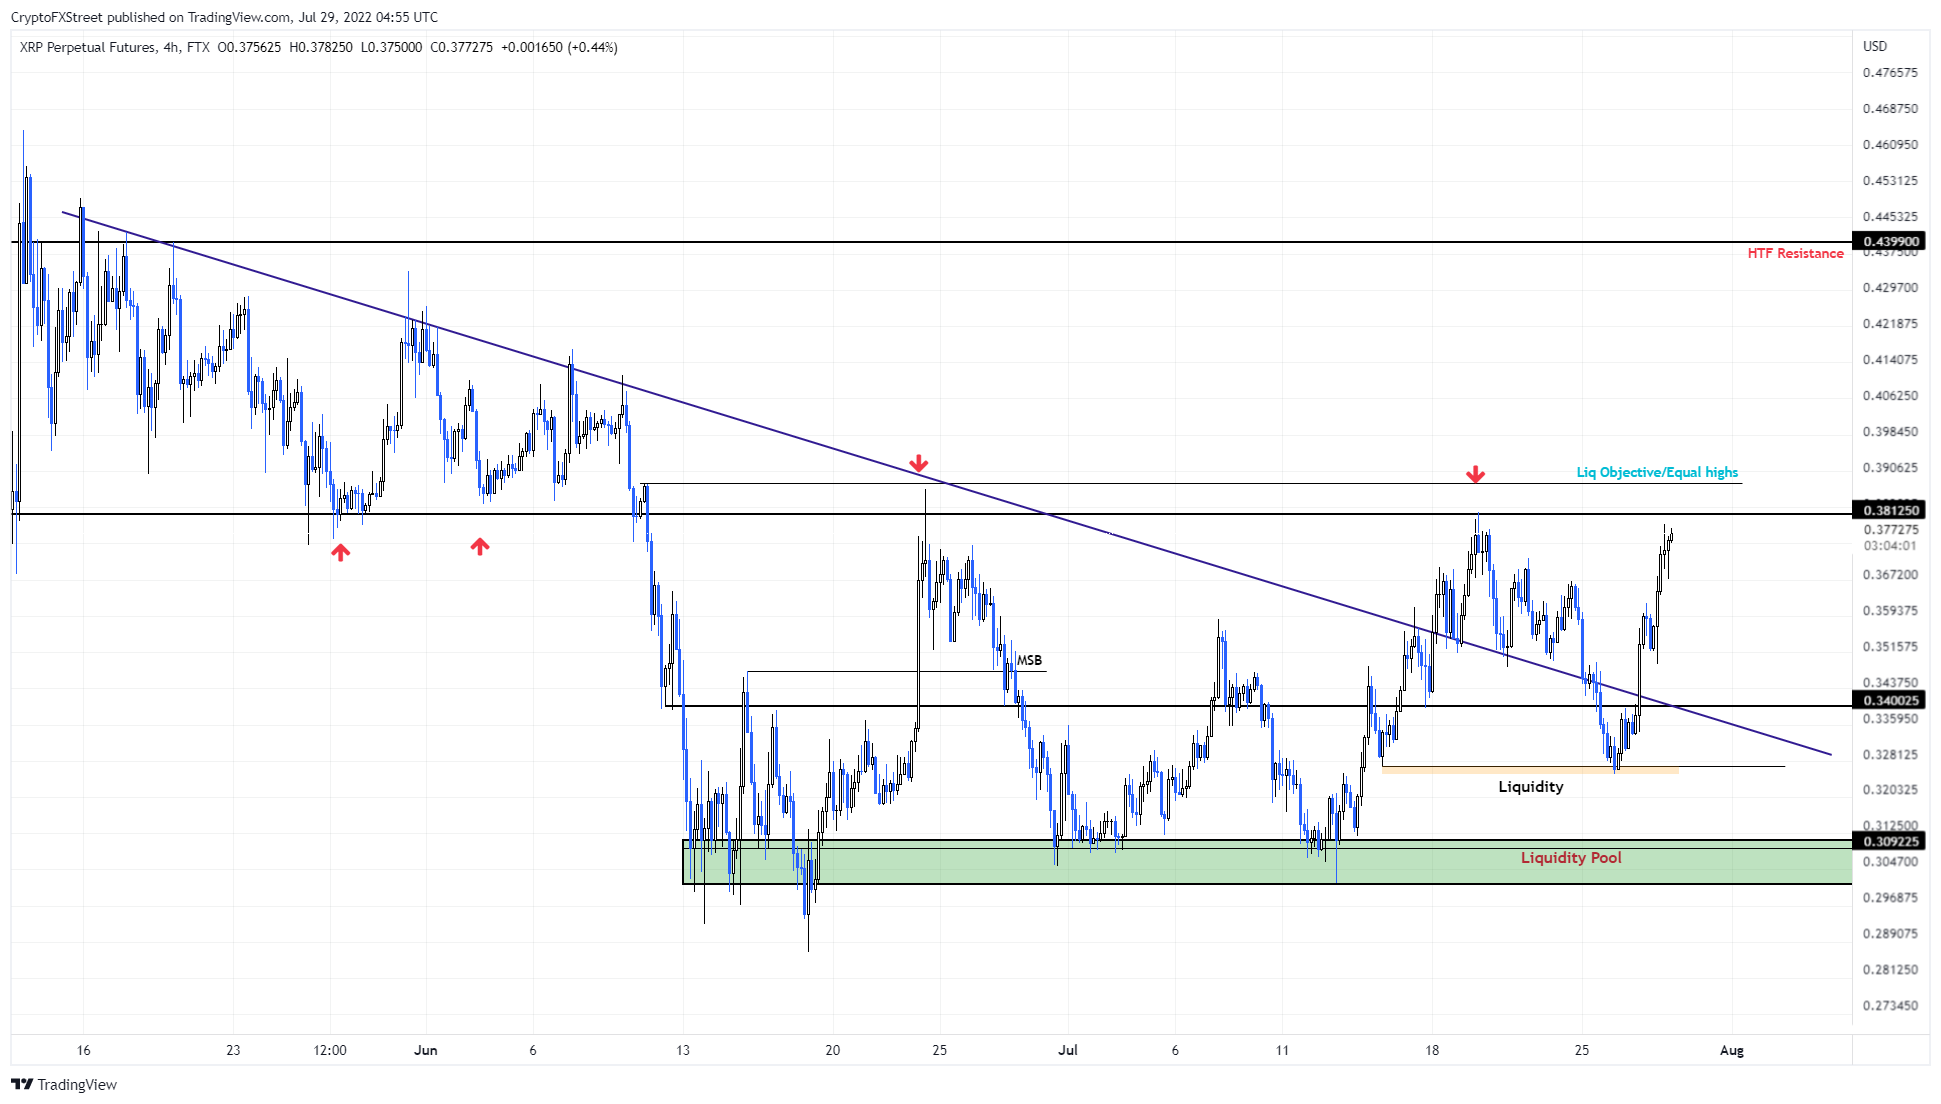
XRP/USDT 1-day chart
On the other hand, if XRP price produces a daily candlestick close above $0.381, the bearish thesis will face invalidation. Such a development could see XRP price extend the rally to the next hurdle at $0.439.
Author

Akash Girimath
FXStreet
Akash Girimath is a Mechanical Engineer interested in the chaos of the financial markets. Trying to make sense of this convoluted yet fascinating space, he switched his engineering job to become a crypto reporter and analyst.



