|

What stopped Bitcoin in its tracks?

BTC USD techncial analysis chart August 8 2019

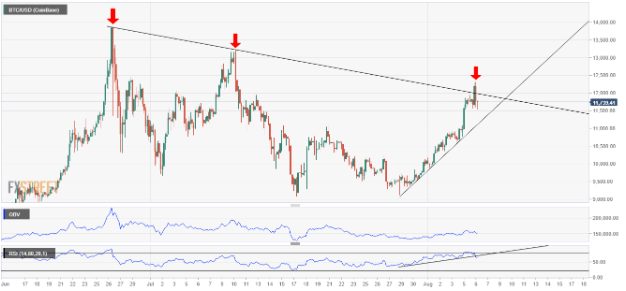
Above is the 4-hour BTC/USD chart that shows there was a key trendline set in place from the high seen on the 26th June to the next lower high made in 10th July. Today the BTC/USD price broke through the barrier but quickly rejected and broke back through backed by large volume.

The RSI indicator has also broken a bearish trendline to break lower. This comes after being in the overbought (positive) zone for some time. Does this mean the upside momentum is done? Not really, maybe it just means the price may have moved too far too quickly and some profit-taking is kicking in.

The on-balance volume (OBV) indicator is showing steadily increasing volume as the upward trend developed. At the top of the trend on the two bar reversal candles the volume peaked. This is also a bearish signal so in the base case view we can expect a pullback before the bulls test BTC/USD higher or the bears drag the price lower. The on-balance volume indicator measures the volume against up candles and down candles. If there is more volume as the price is rising the indicator will move higher and vice versa if prices are moving lover.

Author

Rajan Dhall, MSTA

Rajan Dhall is an experienced market analyst, who has been trading professionally since 2007 managing various funds producing exceptional returns.

More from Rajan Dhall, MSTA
Share:

Editor's Picks

Aster Price Forecast: Demand sparks on Binance Wallet partnership for on-chain perpetuals

Aster is up roughly 9% so far on Thursday, hinting at the breakout of a crucial resistance level. Aster partners up with Binance wallet for the second season of the on-chain perpetuals challenge.

Crypto Today: Ethereum, XRP hold baseline support as Bitcoin struggles to find upside strength

Bitcoin hovers around $67,000, weighed down by risk-off sentiment as reflected by ETF outflows. Ethereum steadies toward the $2,000 psychological threshold despite fading institutional support.

Bitcoin Price Forecast: BTC stalls near $67,300 resistance as downside risks linger

Bitcoin (BTC) price is steadying at $67,000 on Thursday and faces resistance near the previously broken lower consolidation boundary at $67,300, signaling potential downside risk ahead.

LayerZero Price Forecast: ZRO steadies as markets digest Zero blockchain announcement

LayerZero (ZRO) trades above $2.00 at press time on Thursday, holding steady after a 17% rebound the previous day, which aligned with the public announcement of the Zero blockchain and Cathie Wood joining the advisory board.

Bitcoin Price Annual Forecast: BTC holds long-term bullish structure heading into 2026

Bitcoin (BTC) is wrapping up 2025 as one of its most eventful years, defined by unprecedented institutional participation, major regulatory developments, and extreme price volatility.

Bitcoin: The worst may be behind us

Bitcoin (BTC) price recovers slightly, trading at $65,000 at the time of writing on Friday, after reaching a low of $60,000 during the early Asian trading session. The Crypto King remained under pressure so far this week, posting three consecutive weeks of losses exceeding 30%.