What is Bitcoin Value Investing?

Bitcoin Value Investing is an alternative approach towards investing in Bitcoin that eschews the use of traditional technical indicators, and instead focuses on the certain key principles and gathering data from the source. Bitcoin Value Investing is a long-term approach, which is not suitable for identifying daily or intraday trades. Rather, the approach allows the investor to identify larger market cycles and to time entry and exit points. Combined with the use of dollar cost averaging, the idea is to generate capital by investing in Bitcoin which is greater than simply buying and holding or attempting to trade on technical indicators.
Why not TA?
Many people seem to think that Technical Analysis is the only way to play investing or trading Bitcoin. However, I'd like to talk about some of the severe limitations of this approach and explain why I very rarely use these methods.
-
Technical traders rely heavily on volume. But, this is problematic when working in unregulated markets for several reasons. Probably the biggest issue is that most volume is fake! Back in March we learned that fake exchange volume might account for 93% of the total volume, wow!
-
Unregulated exchanges pose many challenges, many of them so unethical that it's mindblowing. For example, Travis Kling, the CIO of Ikigai Asset Management and a former hedge fund manager claims that market makers will literally paint technical indicators in order to induce traders. If you have the time, I recommend watching the full interview from the BlockWorks Group which appeared on the Off the Chain Podcast with Anthony Pompliano.
-
The playing field is not level for retail traders. Algo trading, whales, and market manipulation are rampant. This year we've seen sudden, massive moves that would seem to correspond with the opposite of investor sentiment. For example, when the news about BAKKT was released, the market crashed. When the last batch of ETFs were denied by the SEC, the price went up over the following days. When shorts hit a new high (like they did on April, 9th), the price goes up nearly 50% over the next month, and when the leveraged longs pile up the price seems to magically drop and liquidate the order book. There have even been flash crashes or spikes that seemed to be conspicuously timed around scheduled maintenance over on Bitmex, which happened to liquidate many people while they were unable to access their accounts.
So, while it might be possible to make money trading Bitcoin using technical analysis, I've decided that this approach is not for me. Where does that leave us?
The Underlying Theories and Models
We should start with the basics. Bitcoin is first and foremost a network. So, the first thing to understand is that Metcalfe's Law does apply, even if it's loosely. The idea is that the network grows in value as the number of users grow. With Bitcoin, we do not know the number of users, so we must estimate this value by using a series of proxies (which I will demonstrate for you in later articles).
Second, we just need to think about supply and demand. Bitcoin has a limited supply, so if the network grows then there will be more demand, but not more supply. This tends to push prices up over time.
Third, we need to understand the hype cycle. When Bitcoin's price starts going up, more people are attracted, and they start speculating and trading and bringing in their friends too. Eventually this increased activity turns into a fervor, which causes a market bubble, which will pop and deflate, and lead to a time of price decline and doldrums in investor sentiment. Bitcoin has had several of these cycles so far, and I think there will be more in the future too.
The fourth thing is the advancement of technology. Bitcoin is a technology which is rapidly advancing. The more advanced it gets, the more secure, private, and robust it becomes. As Bitcoin is updated, upgraded and more widely used, the amount of transaction throughput increases as well. This advancement is not a linear process. For example, Bitcoin's TX throughput (the number of transactions per second it can handle) will go from about 7 per second to several thousand per second as the Lightning Network gains traction. How's that for a leap forward?
As a society we have been adopting new technology faster and faster. If Bitcoin can remain relevant over the next ten years, we might see an adoption curve similar to these other technologies listed below.
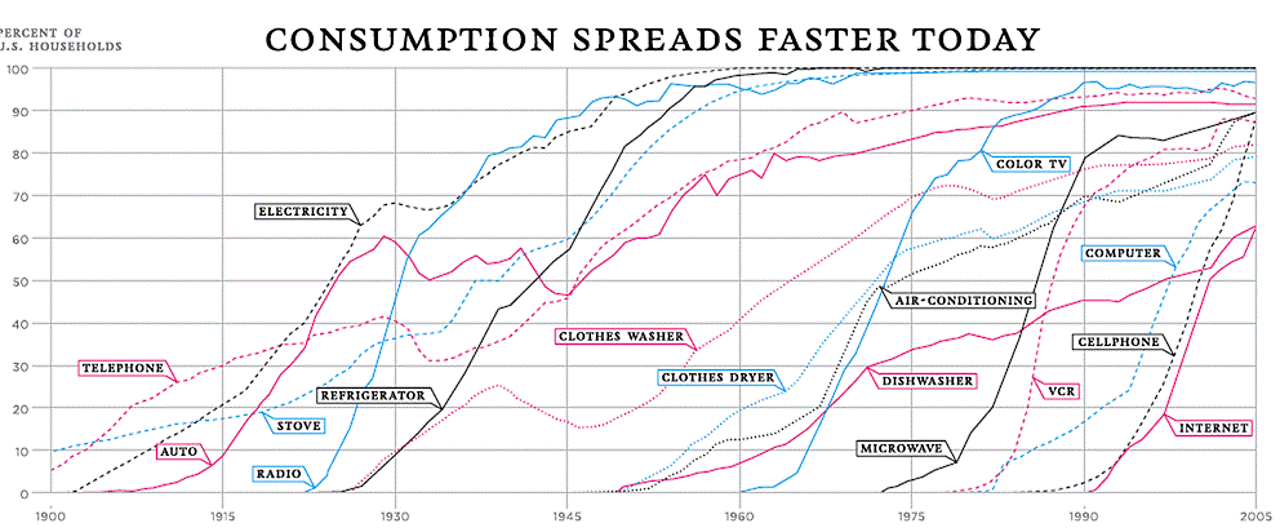
Source: Seeking Alpha
Finding and Understanding the Source Data
Bitcoin of course, is not a company. So, there's no balance sheet or income statement to dissect. Bitcoin has been categorized as a commodity by the SEC, but its founder described it as a peer-to-peer electronic cash system. Whether or not Bitcoin is a commodity, it is the first instance of digital scarcity. Therefore, trying to model its value using approaches like MV=PQ, as if Bitcoin were another fiat currency is sure to fall flat.
Bitcoin is software that's run on thousands of computers around the world. It is an open and permissionless network. As such, it produces reams of data every day. But, which of that is relevant to us as investors? Furthermore, where can we get this data and how do we make sense of it?
I don't want to bore you with all the definitions and sources that are out there, so let's just cover a few of the important ones. First, we have the blockchain. This is where Bitcoin stores every transaction since the project began. It's an immutable source of truth about this history of the network.
What can we learn from the blockchain?
The Bitcoin blockchain contains some very useful information. For example, the number of transactions per day, the number of unspent transaction outputs (the UTXO set), the number of unique addresses in use, and the total number of transactions ever transmitted.
Additionally, beyond the blockchain we have data that comes from the Bitcoin mining network, such as hash power of the network and the difficulty of the mining algorithm (recall that the supply is fixed, so more Bitcoin miners does not equate to more Bitcoin, it equates to a harder problem for all the miners to solve).
From the full nodes, we can also look at the current fee being paid for an average transaction, how many transactions are waiting to be confirmed (the mempool), and what the transaction throughput of the network is right now.
You might be thinking, "this is all well and good, but what can we do with this information?" Indeed, that is the question. But first we need to consider how to think about this data.
Thinking in Log Scale
Let's try a little experiment. Take a look at this chart below.
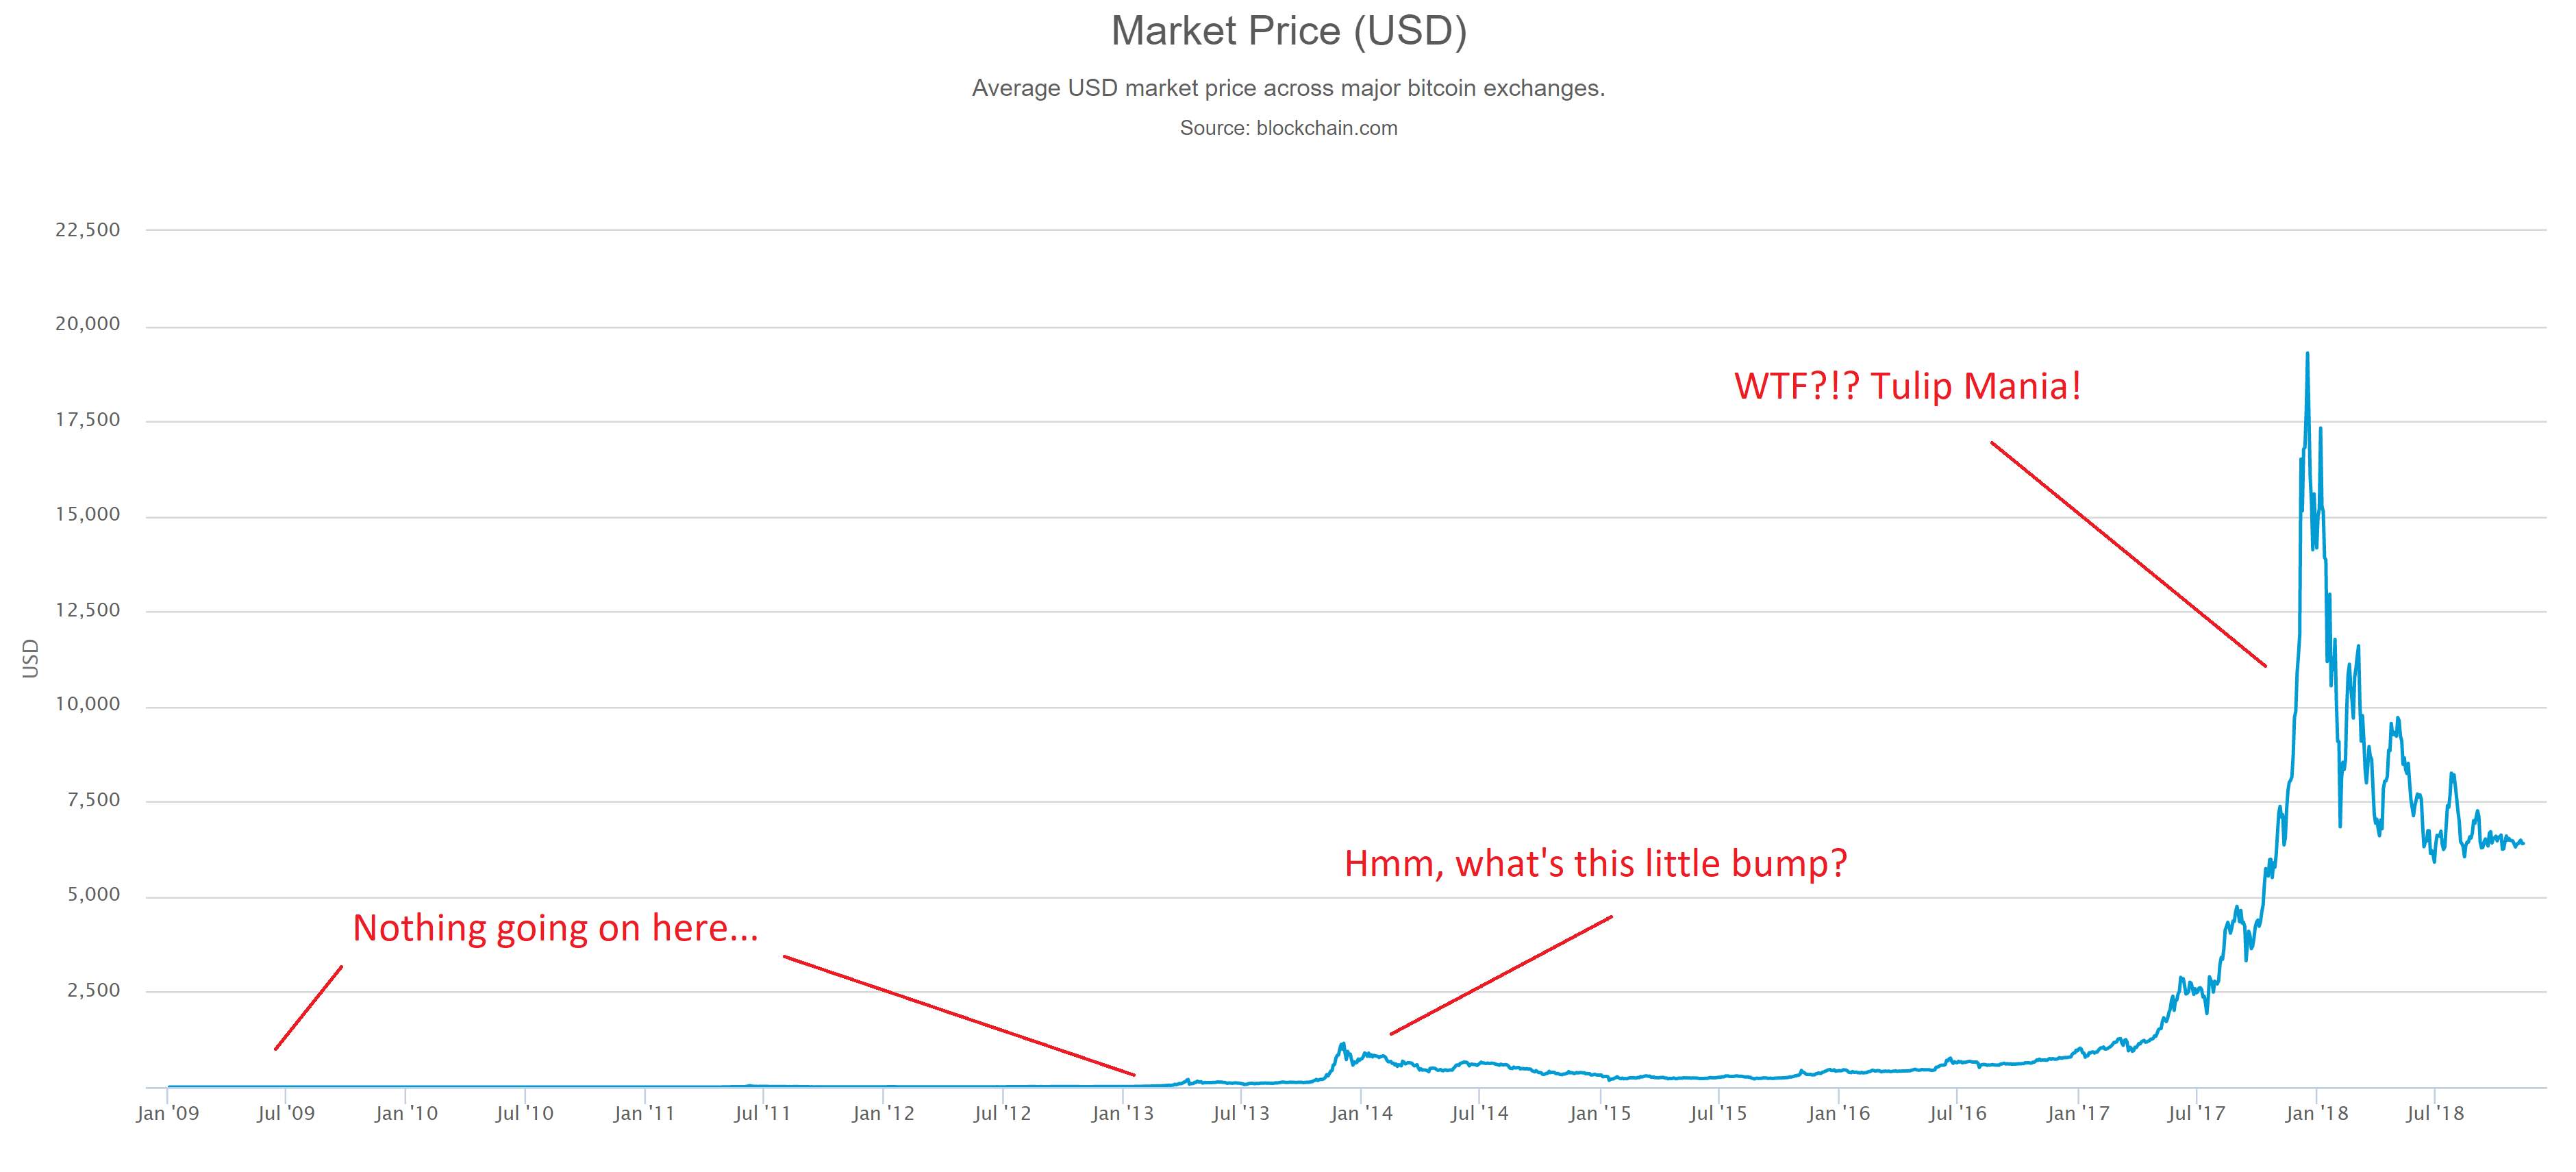
Source: blockchain.com
It seems like the price of Bitcoin just "popped" into existence out of nowhere. What kind of a moron would try to invest in a market like this? But what if we changed our perspective a bit and look at this data in log scale. Why log scale? Well, it turns out that humans are notoriously bad at understanding exponential functions and log scale events. This chart isn't doing us any favors being laid out in this way.
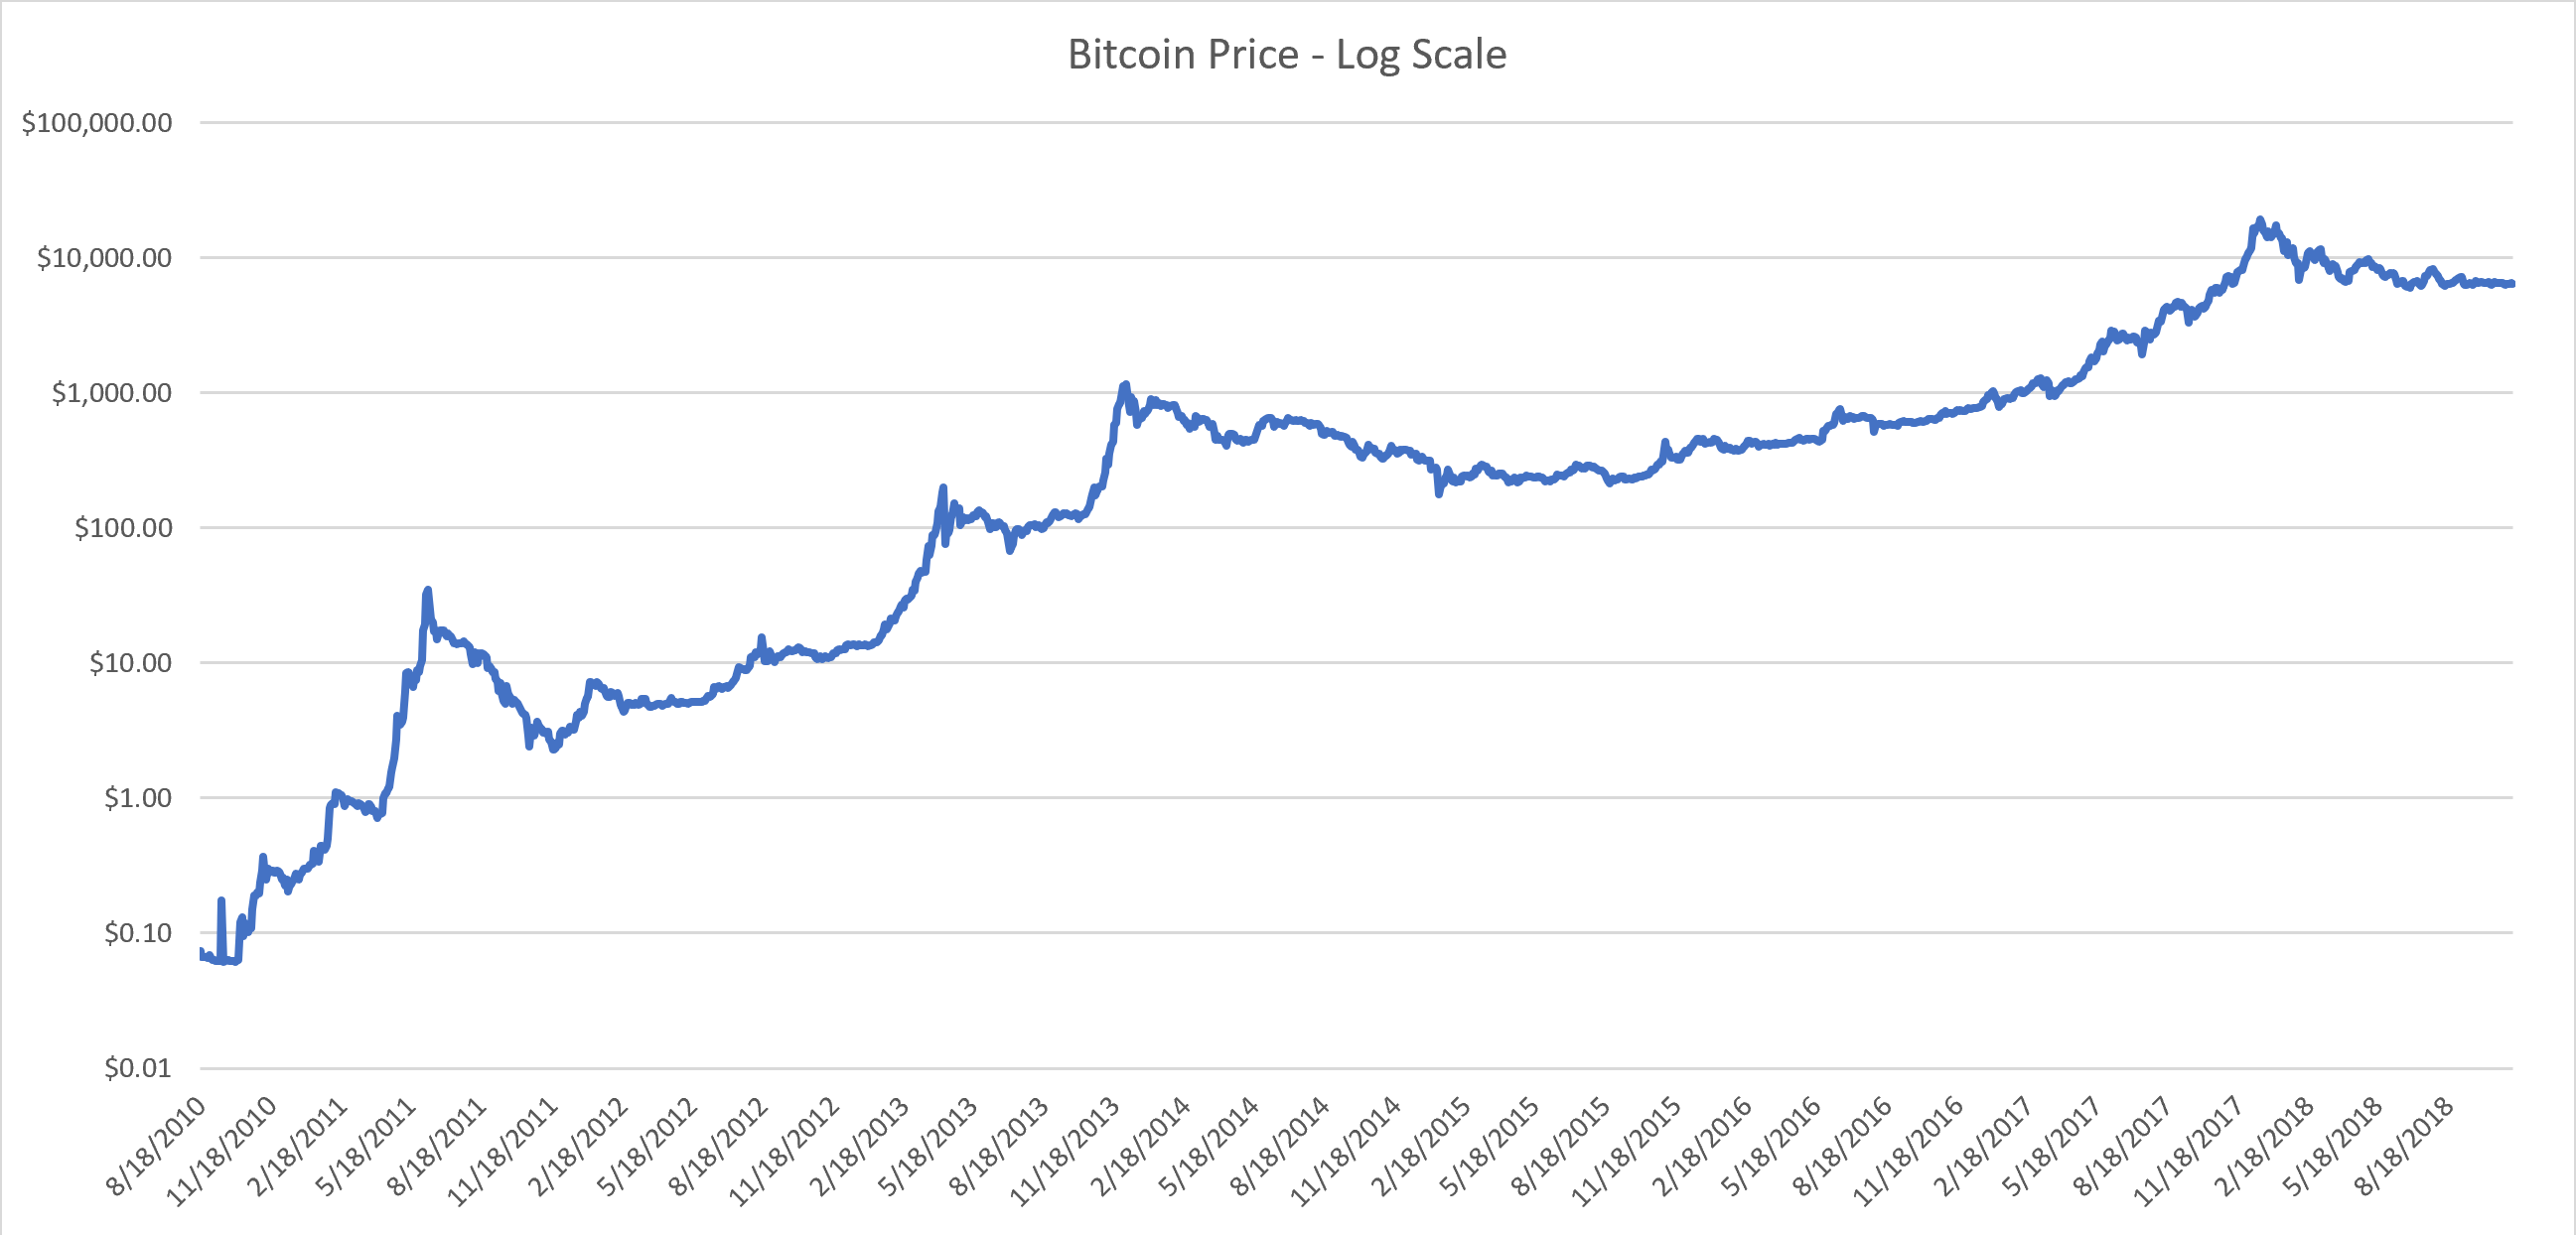
Source: blockchain.com and author’s charts
This chart makes a bit more sense, doesn't it? You see, Bitcoin is an exponential phenomenon. Its growth is playing out in log scale and has been since the project first came out. Thinking in this way enables us to make much more rational decisions about where we came from and where we might be going with Bitcoin's price in the future.
But, it's not just Bitcoin's price that's growing in log scale, it's also the underlying fundamentals! Let's look at the hash power of the network in linear scale, and then in log scale.
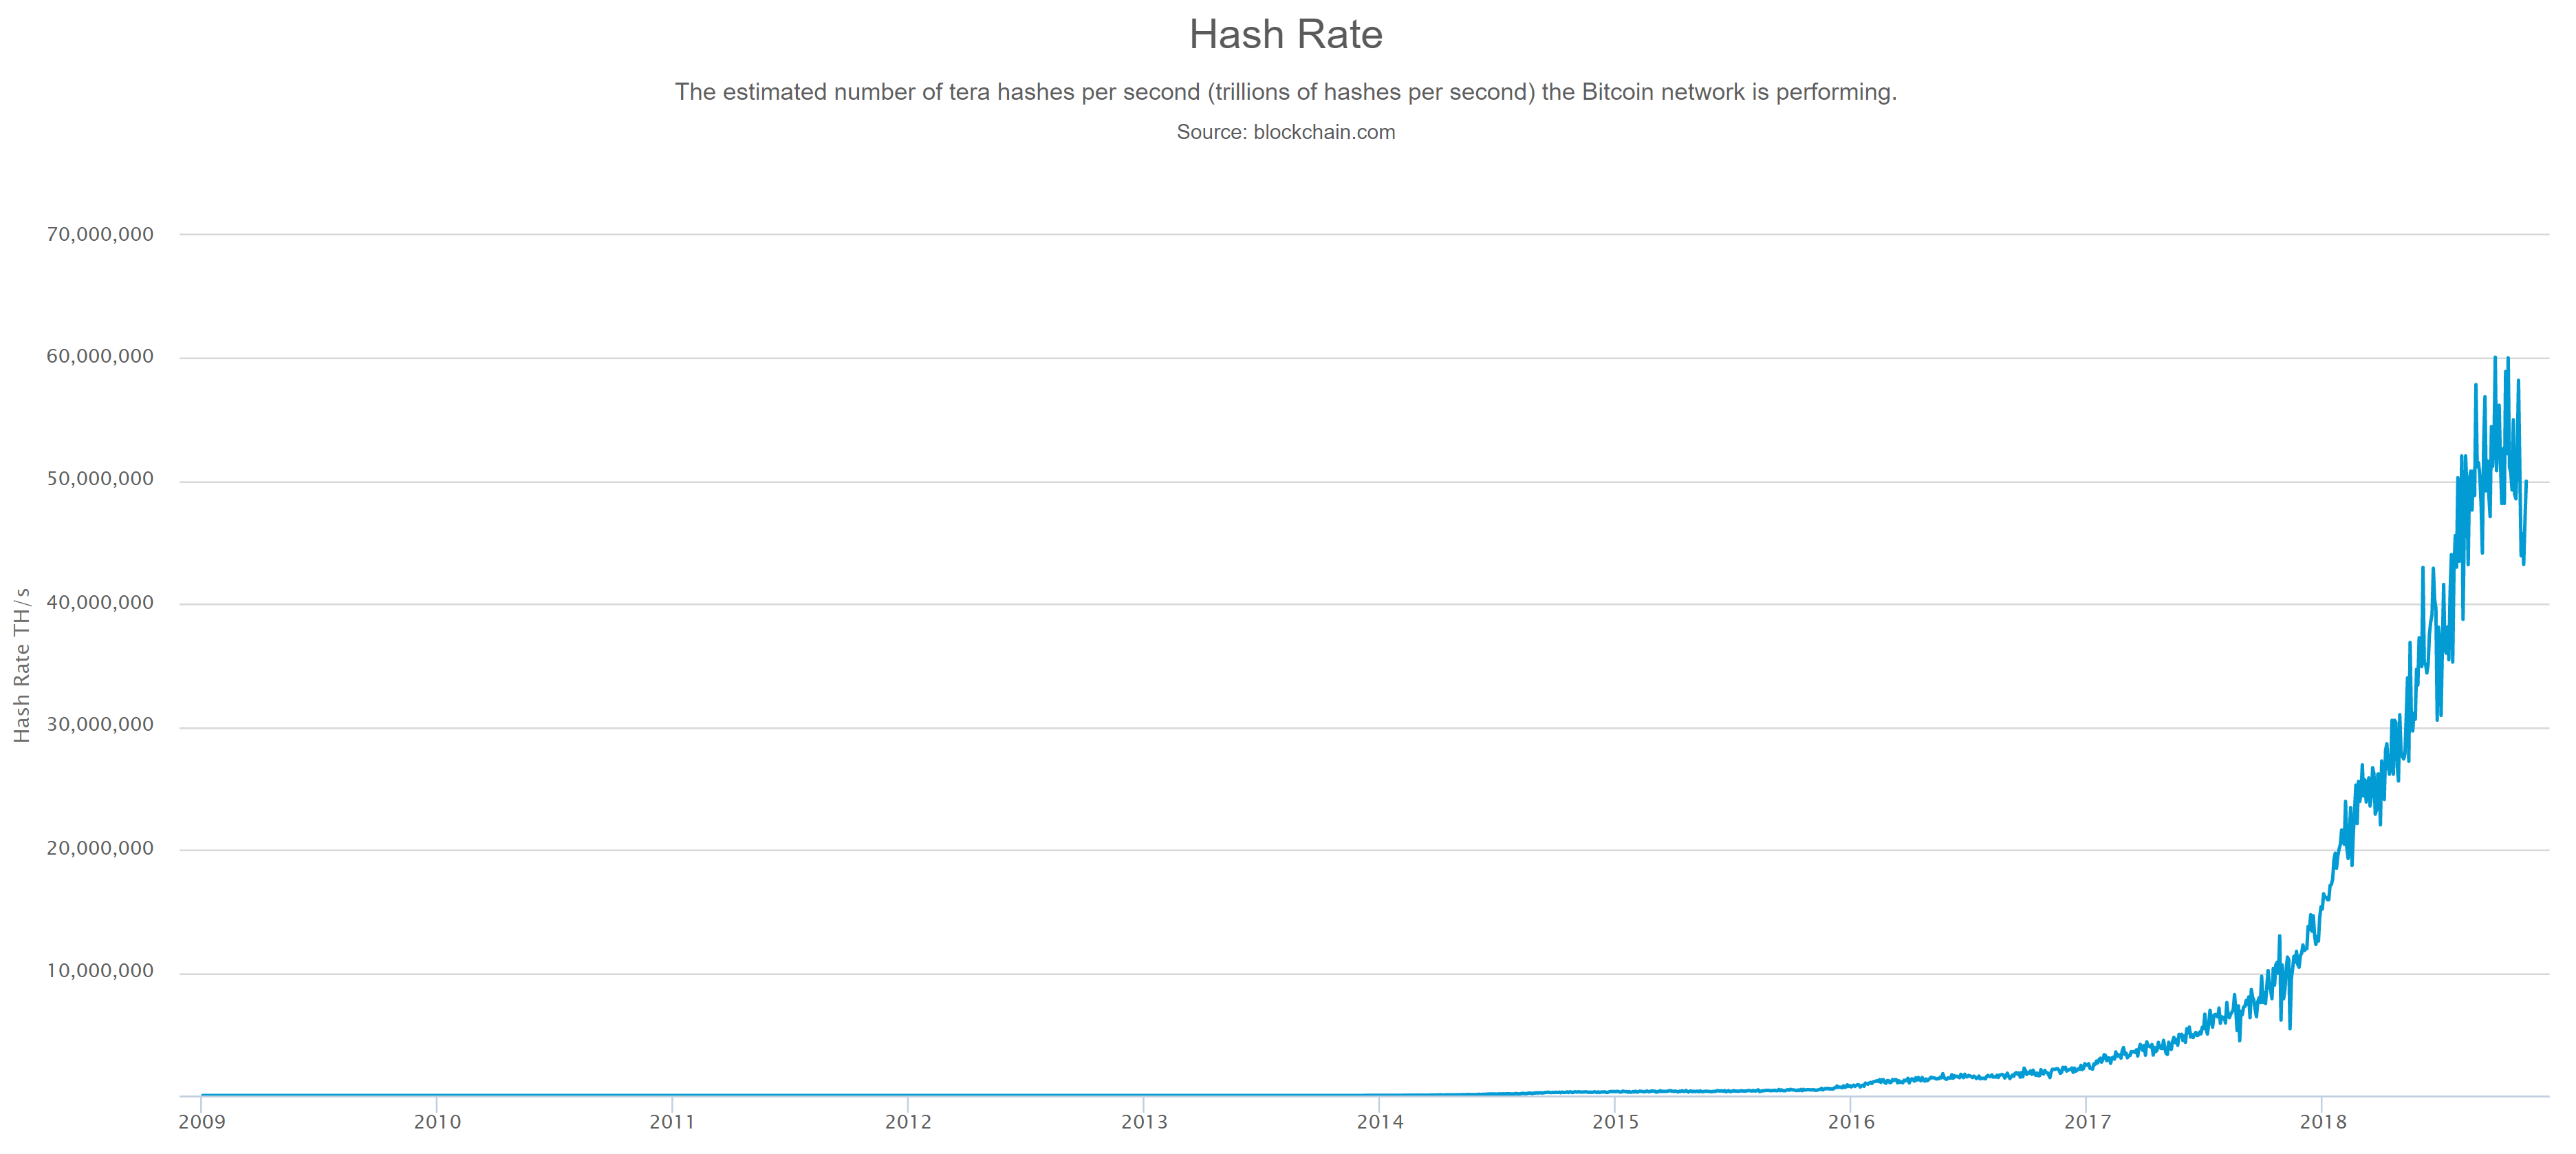
Source: blockchain.com
Doesn't make much sense, does it? It looks like a bunch of people started mining Bitcoin in 2015 and now there's so many that we might risk destroying the planet with our reckless energy consumption. But, let's look in log scale just to see if we can get some more color on the situation.
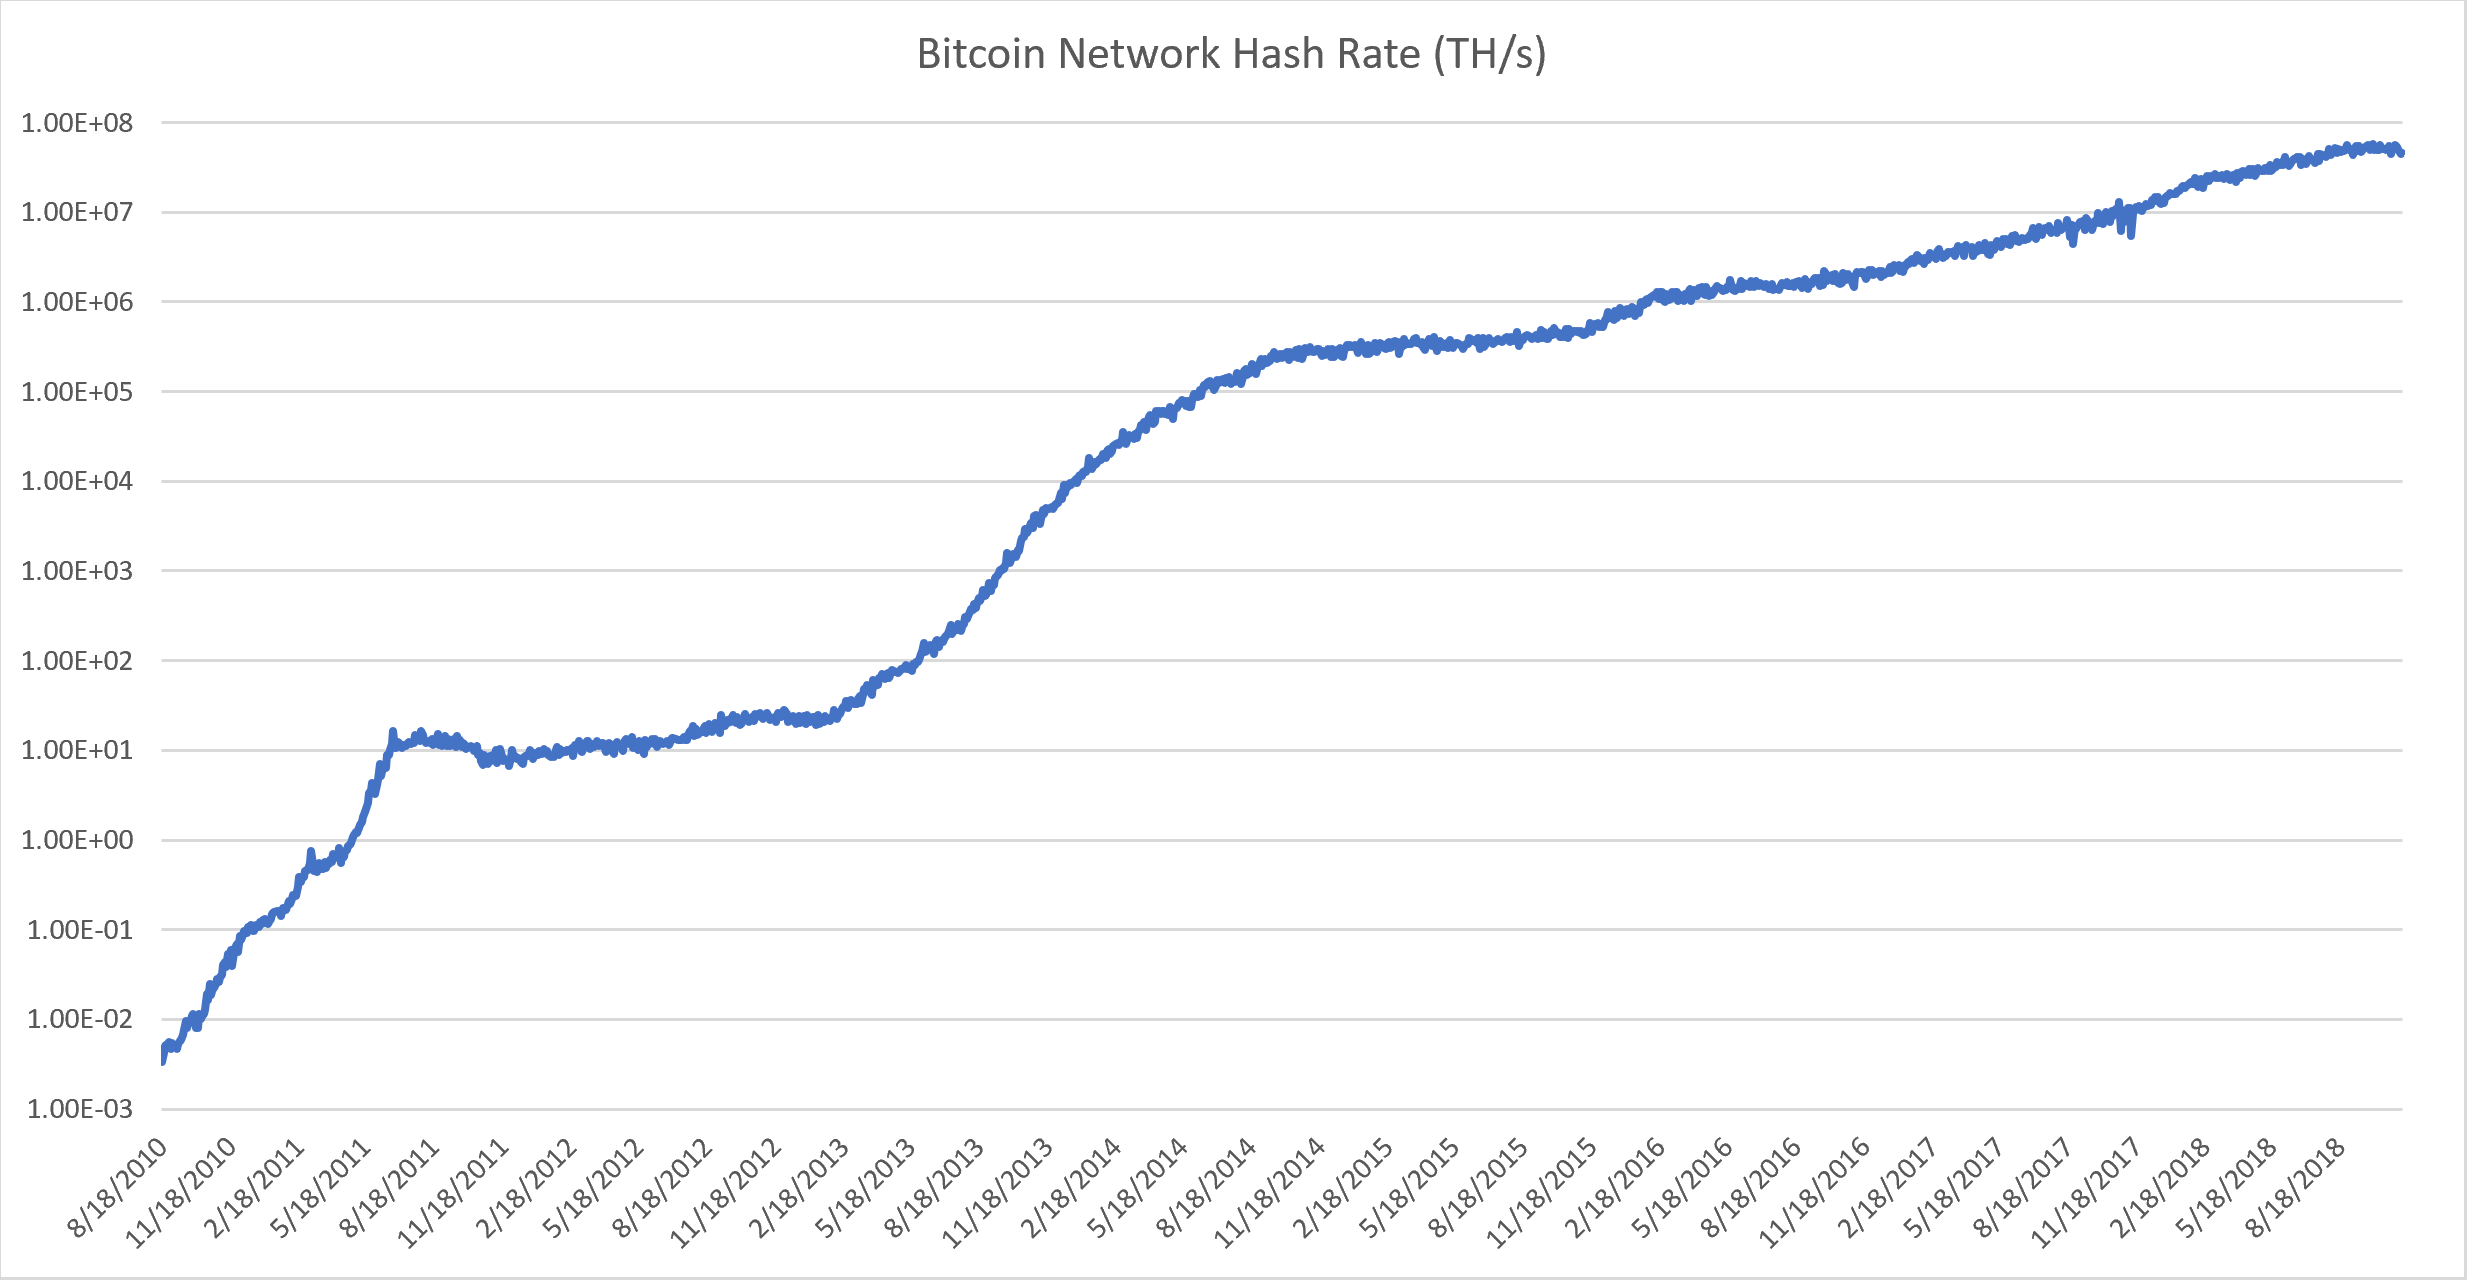
Source: blockchain.com and author’s charts
Wait a minute here. Using this approach, the hash power of the network seems to be humming along and growing constantly, almost predictably over time. This is how we turn data into information, folks!
What can we do with this information?
Back in 2011, computer scientist Hal Finney noted that there was a relationship between the hash power of the Bitcoin network and the price of Bitcoin. In my opinion the relationship works both ways. A higher price of Bitcoin will attract more miners, but more miners also means that Bitcoin is more globally distributed, more secure and has been around long enough that people are willing to invest billions of dollars in CAPEX. Bitcoin mining operations are large, expensive and highly technical. On top of that, you need a cool climate and really cheap power if you're going to succeed.
I started to wonder if we could model this relationship in such a way that it could become a useful tool for investors. The reasoning is that sometimes the market tends to be overheated when a sudden flood of new investors speculate the price to new highs. Conversely, there are times when the price of Bitcoin may be below what we would expect for the current epoch and the power of the Bitcoin mining network.
While the price of Bitcoin is traditionally quite volatile, the hash power of the network is more stable because it's not trivial to start or stop mining. These are big decisions that take time. Dirt literally has to be moved, and infrastructure has to be built. With the hash power of the Bitcoin network as a barometer, I'd like to introduce Bitcoin Value Investing technique number 1 – The relationship between hash power and Bitcoin market cap.
Bitcoin network hash power and Bitcoin price
Remember how we talked about thinking in log scale earlier? Well, what if we took the Bitcoin market cap in log scale, and compared that with the hash power of the network in log scale? I took a monthly average of each going back to 2010 and ran a regression analysis on the data set. This was the result (which you are welcome to verify yourself).
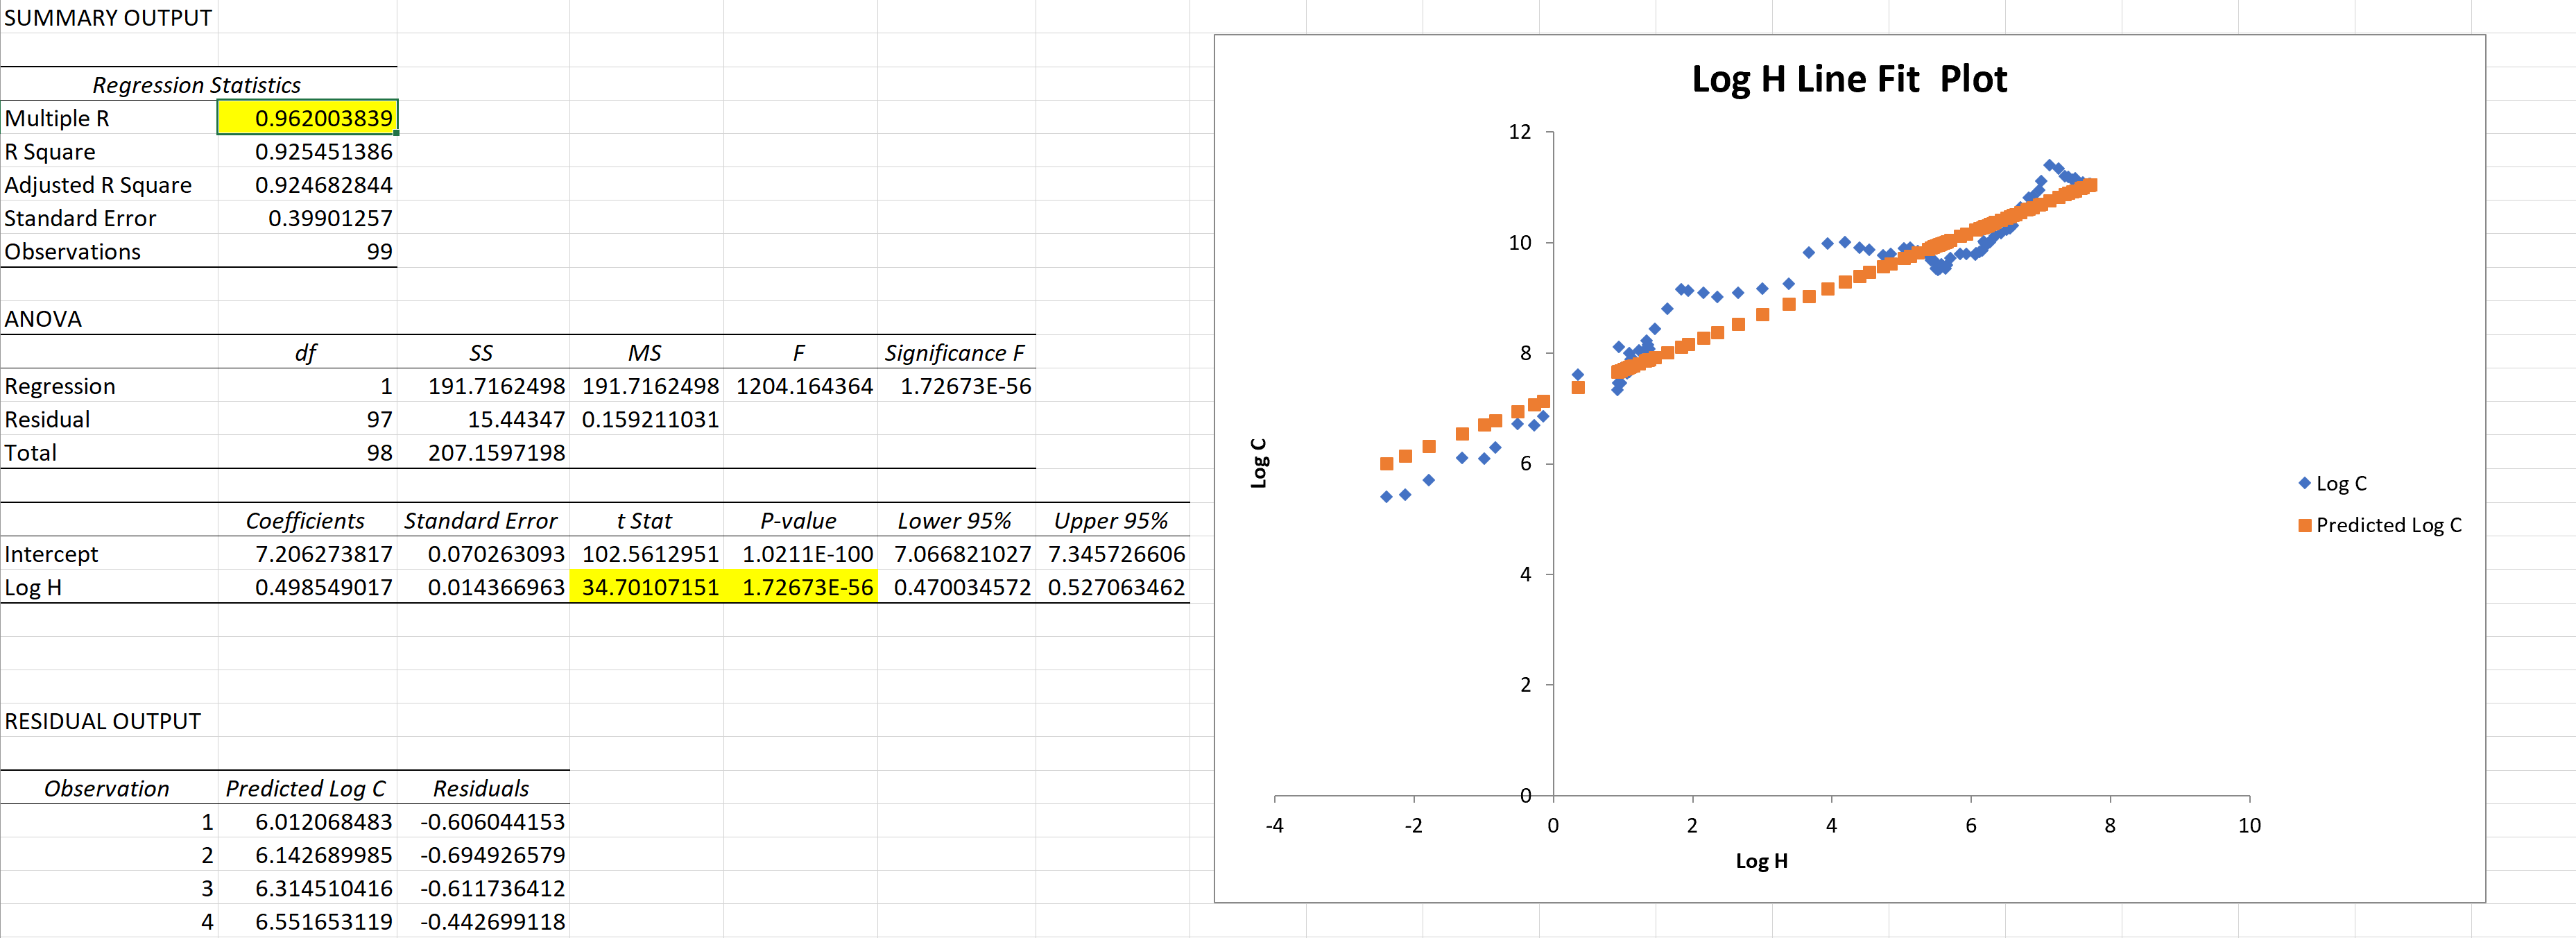
Source: blockchain.com and author’s excel
This relationship is nothing to sneeze at. A correlation of .962 is very strong, and we're also seeing a Pvalue that's very small combined with a large T-stat. Next, I took the readings from the hash rate and plotted the market cap predictions versus reality. This was the result.
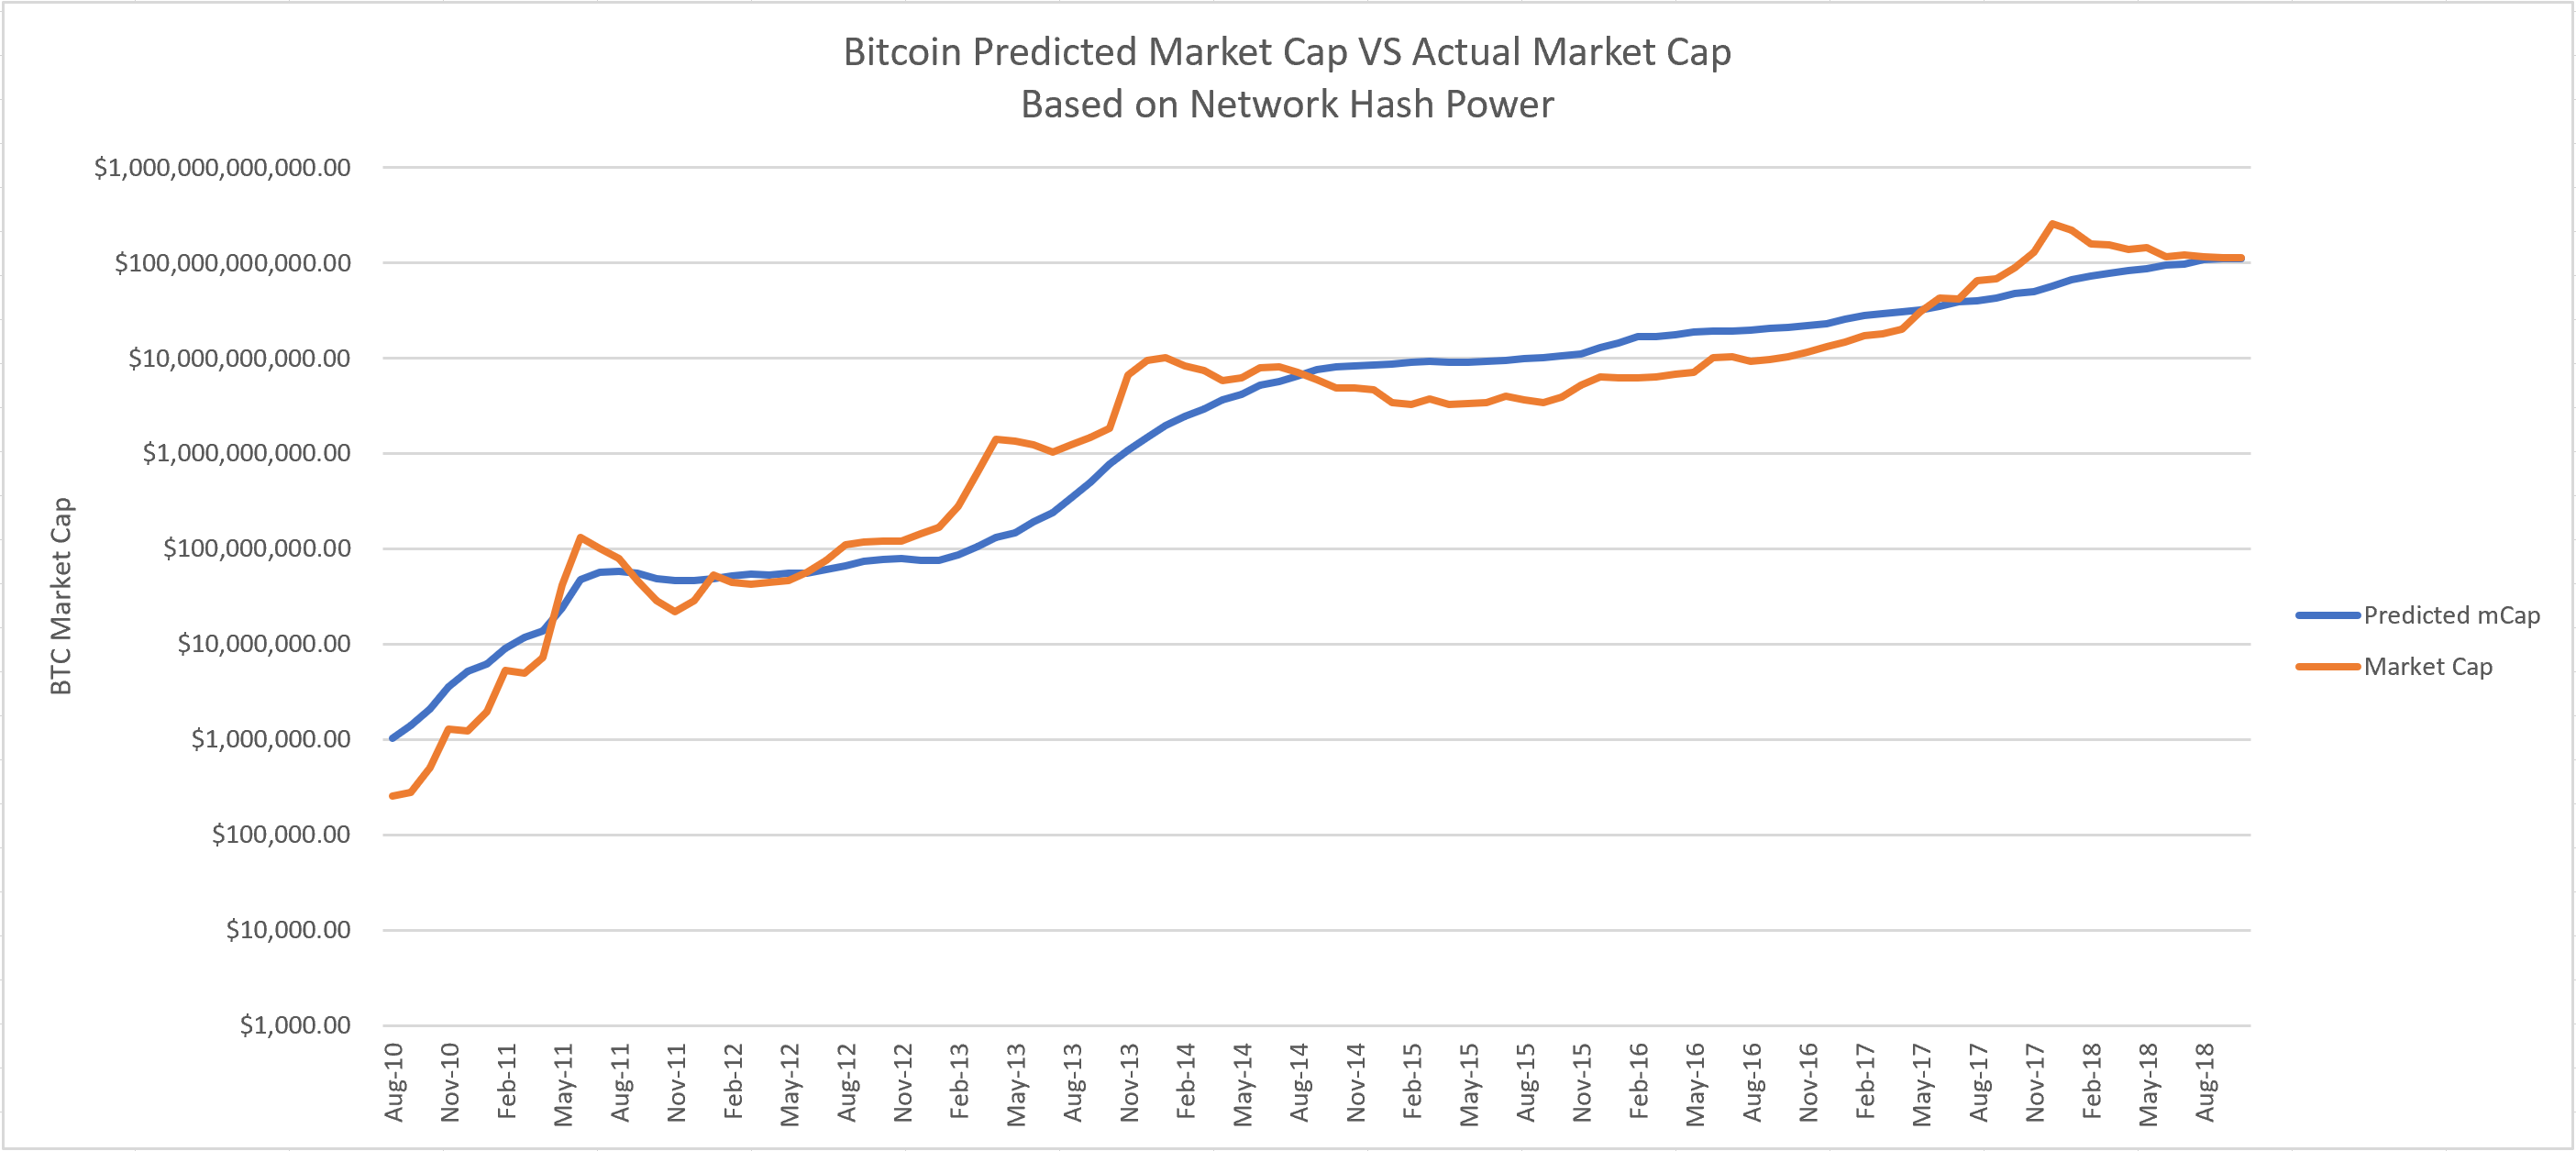
Source: blockchain.com and author’s excel
As you can see, this model provides some very useful insight. Namely, when the orange line is above the blue line, a long-term market correction (bear market) tends to follow. Also, when the orange line is below the blue line, a bull market seems to follow over the next months and years. Interestingly, the market cap right now seems to be very close to what the model predicts.
Next, I took the price and divided it by the predicted value. Then, I standardized this ratio using Z-scores and plotted the result. See below:
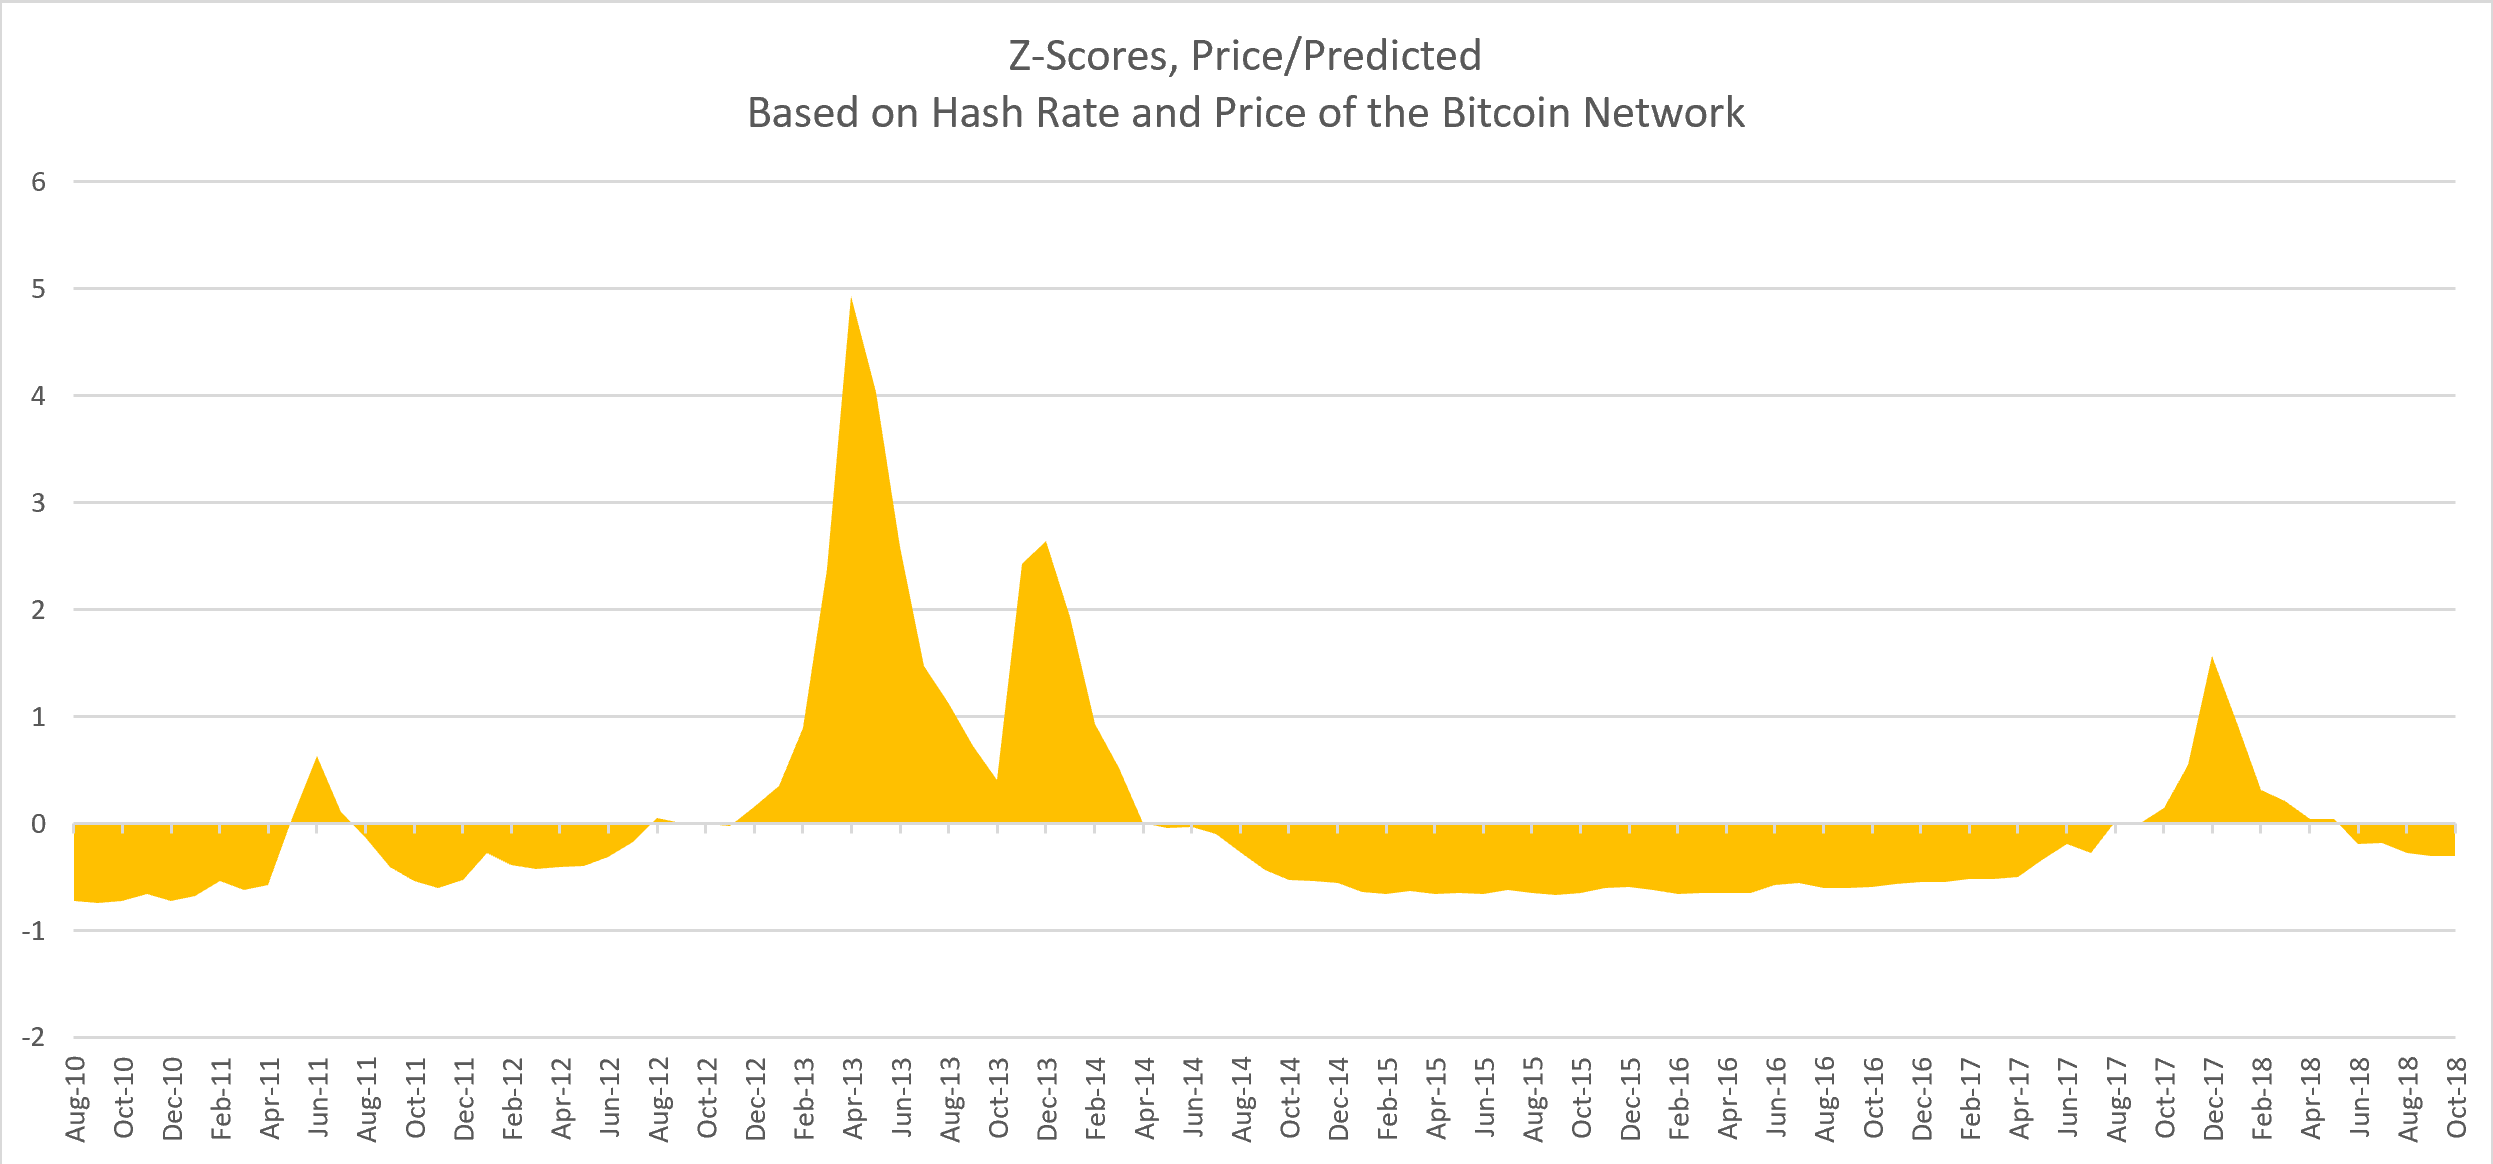
Source: blockchain.com and author’s excel
As you can see, spikes in the Z-score tend to be associated with times with the Bitcoin market cap was bid up to unreasonable levels, while the opposite end (the low Z-scores) can help us to identify when there might be an optimal entry point into the market.
In order to explore this concept further, I have created another chart that shows the high, low, and quartile ranges that the model predicts. The red layer represents the highest relative prices expected, the green is the lowest, and the blue at the bottom represents the "floor," an area below which there has never been a reading.
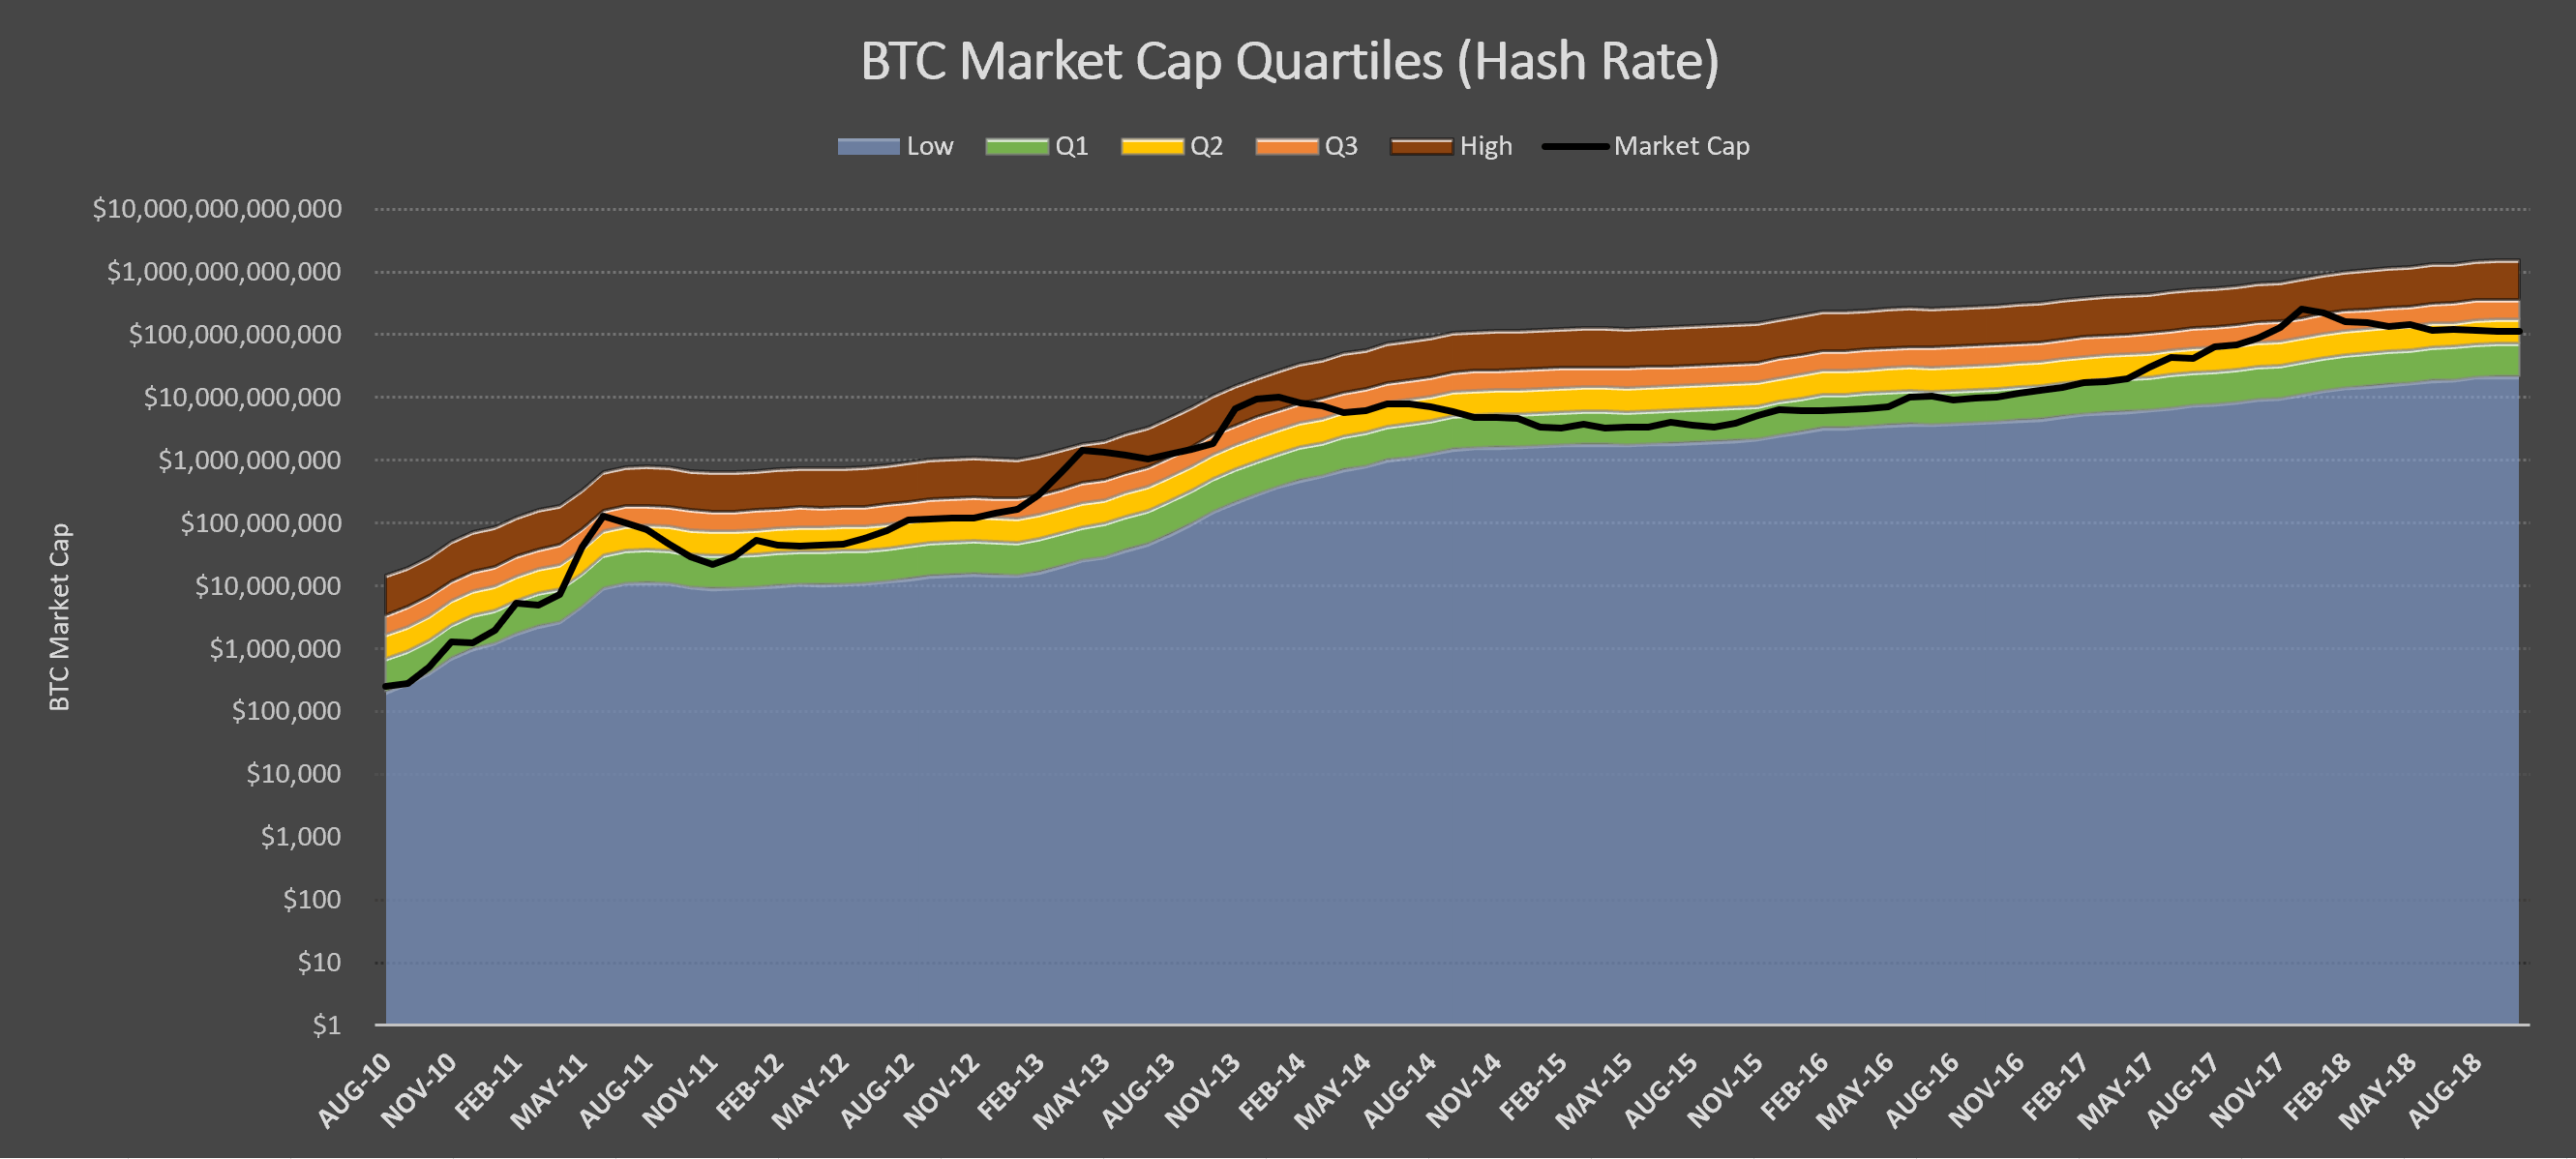
Source: blockchain.com and author’s excel
Using this chart, you can see that we're very close to the green layer, which has indicated the start of a long bull market in the past (yes, the past cannot predict the future, but it's useful to have some perspective from the past to inform us to some extent). Also note that the floor tends to ratchet up over time. So, a price that's too high today, might be too low at some future point. In other words, prices are relative to the time in which they are taken and should not be viewed in isolation.
Conclusion
Becoming a Bitcoin value investor is a long road, but I'm here to help! This technique that I have described is just the first of many that I use to evaluate the current market cycle and value versus price (or the current market cap in this case). In the coming weeks I will introduce additional methods, which I have also described over on Seeking Alpha, where I have been writing since May of this year. If you like this article, please leave me a comment below and feel free to share with your friends and colleagues. I can also be found on Twitter if you're so inclined.
Author

Hans Hauge
Independent Analyst
A cryptocurrency entrepreneur, author and analyst; currently the opinion leader on cryptocurrency on Seeking Alpha.


