VeChain Price Forecast: VET postures for a 40% gain as energy builds
- VeChain price is struggling to overcome the Anchored VWAP at $0.087 that began on January 3, 2021.
- VET came close to activating the double bottom on August 1.
- The six-hour chart reveals a Golden Cross is fast approaching, suggesting higher prices.

VeChain price has built on the rebound from the 50-week SMA, registering a 15.21% gain last week and closing July with a minor decline of -1.64%. The persistence of the Anchored VWAP has been containing a rally continuation since the July 26 high and preventing VET from triggering a double bottom pattern. Until the altcoin actives the double bottom pattern, the outlook is neutral with the outside potential for a mild pullback.
VeChain price in the crucial hours of the bottoming process
VeChain price has manufactured a 45.88% gain since July 21, carrying the cryptocurrency near the double bottom trigger price of $0.095 and the strategically important 200-day SMA at $0.097. Moreover, the tight VET price action over the last seven sessions has compressed the Bollinger Band to the narrowest range since the decline in early July.
The VeChain price contraction has positioned VET to experience a sharp move in the coming days. After triggering the double bottom, a resolution to the upside will struggle with the 200-day SMA at $0.097. Following a successful breakout above the long-term moving average, the digital token is cleared to test the 38.2% Fibonacci retracement level of the April-May correction at $0.133, delivering a 58% return from the current price. The Fibonacci level will be firm resistance due to the price congestion in late May and early June.
The measured move of the double bottom is 41.69%, presenting a VeChain price target of $0.135, which is slightly above the 38.2% retracement level of $0.133.
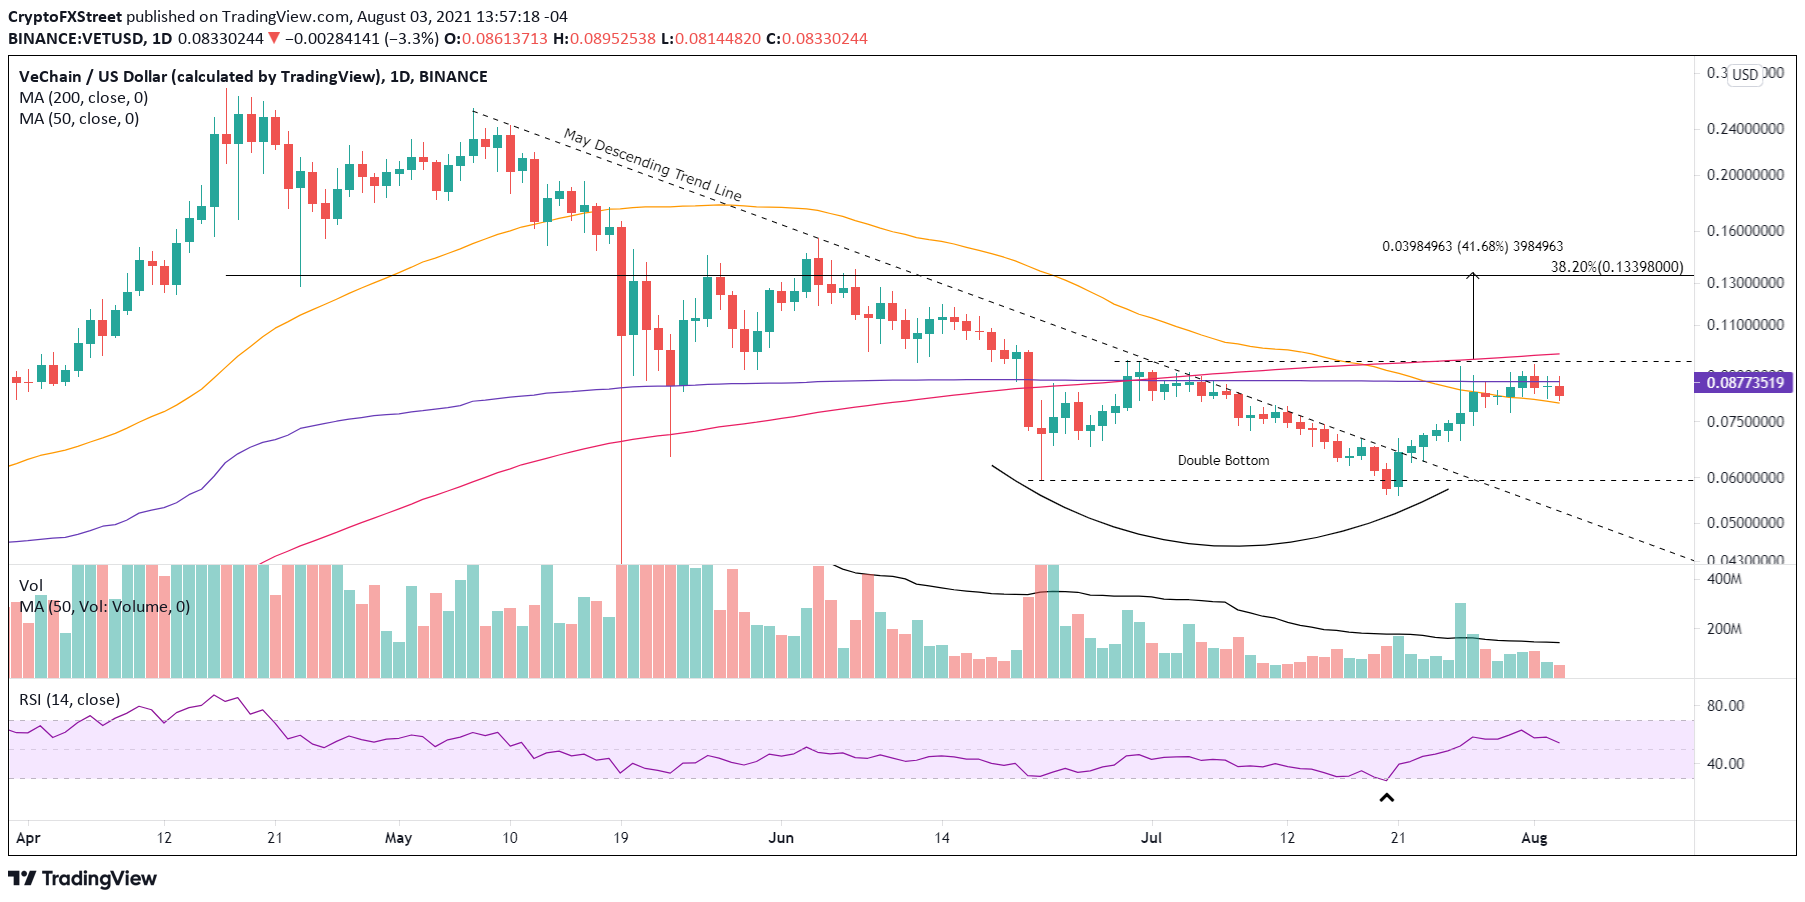
VET/USD daily chart
Adding to the bullish VET narrative is the approaching bullish Golden Cross pattern on the six-hour VeChain price chart. The pattern is activated when the 50 six-hour SMA crosses above the 200 six-hour SMA. The last Golden Cross on the six-hour chart occurred in November 2020, right before the beginning of the considerable advance into the April high.
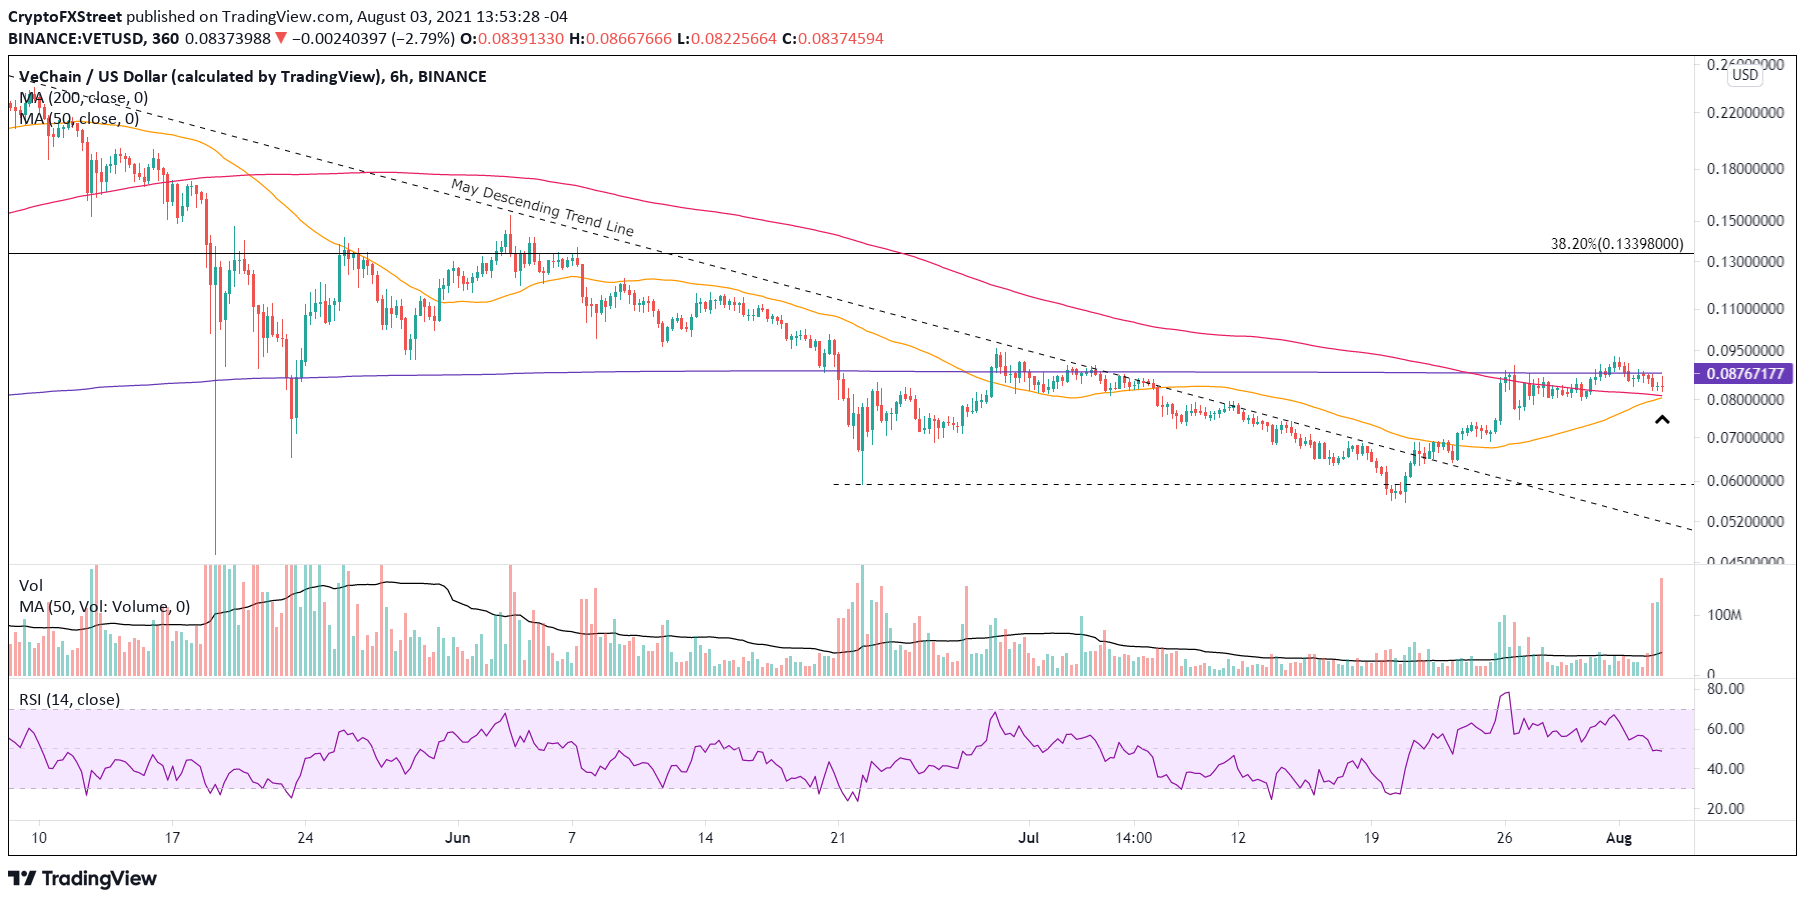
VET/USD 6-hour chart
VeChain price is in the crucial hours of the bottoming process as resistance is gaining influence, and the downside is only protected by the 50-day SMA at $0.080. A failure at the tactically important moving average needs to attract support at the June 27 low of $0.073, or VET is at risk of a deeper correction, potentially to the June 22 low of $0.059. The retracement would point to a more complex bottoming process or signal that the rebound was just due to an oversold condition on the daily Relative Strength Index (RSI).
VeChain price has the price structure to reach bullish outcomes if it can overcome the suffocating resistance of the Anchored VWAP and the 200-day SMA. Still, the contraction in price should amplify the price energy to make a breakthrough.
Author

Sheldon McIntyre, CMT
Independent Analyst
Sheldon has 24 years of investment experience holding various positions in companies based in the United States and Chile. His core competencies include BRIC and G-10 equity markets, swing and position trading and technical analysis.


