VeChain price foothold may crumble, leaving VET to test April lows
- VeChain price holding tactical 50-day simple moving average (SMA).
- Ichimoku cloud intersects with tactical moving average, offering additional support.
- Largest three-day decline since March 2020 begins the final leg of an ABC correction.

VeChain price decline below the multi-day ascending channel has introduced a new vulnerability for VET to the oscillations of the cryptocurrency complex. At the moment, the altcoin is being protected by the 50-day SMA. However, guided by the measured move target of the ABC correction, VeChain price should dive below the April 23 low before locating a meaningful bottom.
VeChain price loses the edge against Bitcoin
A 29% decline for VeChain price over three days finally fractured the underlying support of the ascending channel’s lower trend line. Of course, market observers mainly attributed the sell-off in VET to the immediate contagion associated with Elon Musk’s surprising announcement that Tesla would not accept Bitcoin as payment for cars due to his worries about the impact of mining on the environment.
A closer review of the daily VET chart reveals that the rebound from the April 23 low to the May 7 high was corrective, defined by a lack of impulsiveness and accumulation. A bullish evaluation of the cryptocurrency would have generated a substantial rebound following the 55% crash in April.
VeChain price has confirmed the beginning of the C leg of the ABC correction with a measured move target of $0.120 or a 30% decline from the current price. The projection is compiled using the 54% decline from the Apri 17 high at $0.282 to the April 23 low at $0.128 (Point A). A 54% decline from the May 7 high at $0.260 (Point B) equals the measured move target of $0.120 (Point C).
The projected target will undercut the April 23 low at $0.128, thereby shaking out the weak holders of VET that held through the first decline. An acceleration in the selling pressure may knock VeChain price down to the 38.2% Fibonacci retracement at $0.108. The Fibonacci level corresponds to the rally that began from a cup-with-handle breakout at the beginning of 2021.
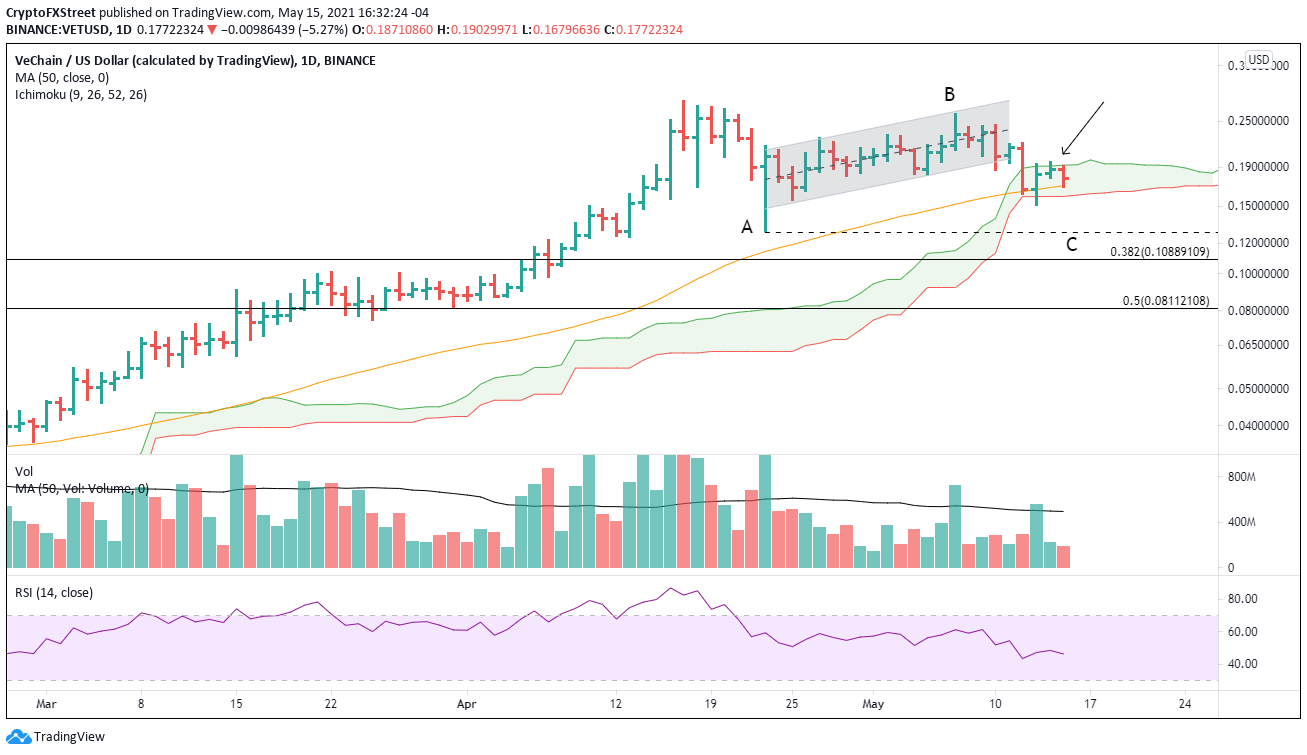
VET/USD daily chart
It is crucial to consider the bullish alternative considering that VeChain price is currently sitting on a solid support level framed by the 50-day SMA and Ichimoku cloud. The potential exists that the crash through the ascending channel was sufficient to remove the weak holders and the new support offers an opportunity for eager VET investors.
The primary upside targets for VET are Point B at $0.260 and the all-time high at $0.282.
As measured by the number of VET mentions on 1000+ crypto social media channels, including Telegram groups, crypto subreddits, discord groups, and private trader chats, the social volume has been trending lower since April 16.
Naturally, the social volume would turn lower with price, but during the corrective bounce following the 50% decline in April, social volume maintained the downward trajectory, except for one brief respite. Although VeChain price came within 10% of the April high, the lack of coverage in social media speaks to its declining interest and relative strength in the cryptocurrency complex.
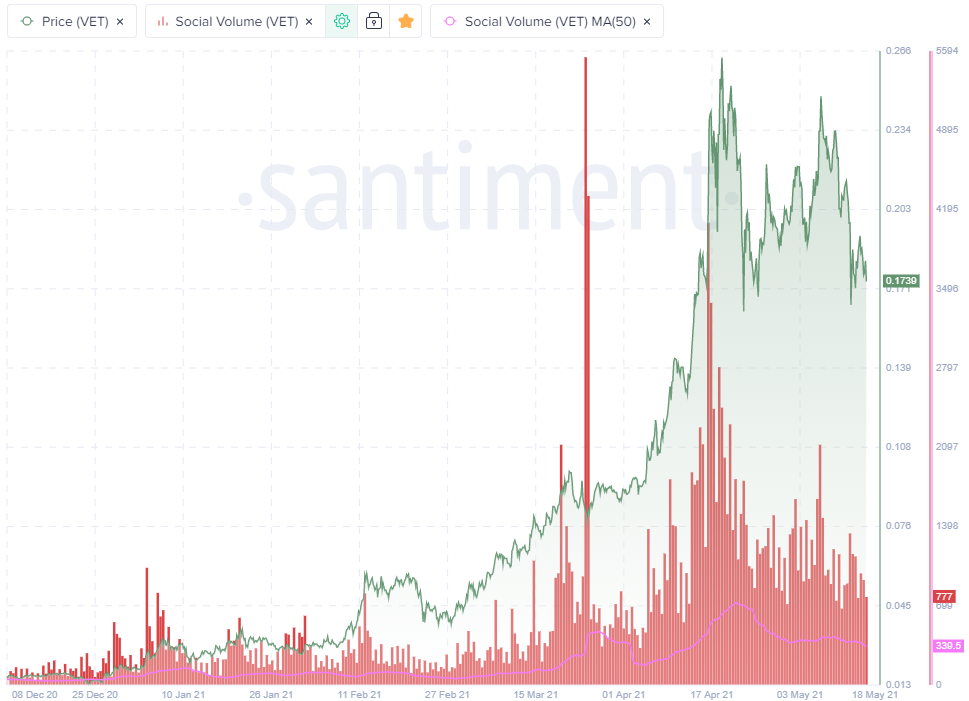
VET social volume
For now, the attraction for VET has notably subsided, and the price structure tilts bearish leaving VeChain price outlook vulnerable to ongoing turbulence in the broader market.
Author

Sheldon McIntyre, CMT
Independent Analyst
Sheldon has 24 years of investment experience holding various positions in companies based in the United States and Chile. His core competencies include BRIC and G-10 equity markets, swing and position trading and technical analysis.


