VeChain price correction resumes, leaving VET vulnerable to a 30% decline
- VeChain price shatters ascending channel with largest three-day decline since March 2020.
- VET currently stabilizing at the intersection of the 50-day simple moving average (SMA) and Ichimoku cloud.
- Chart projects the continuation of a simple ABC correction.

VeChain price collapse below the ascending channel has augmented the vulnerability of VET to the ongoing volatility in the cryptocurrency market. It is currently being sheltered by the 50-day SMA but based on the measured move target of a simple ABC correction, VeChain price will undercut the April 23 low before discovering a firm low.
VeChain price confidence vanishes with one comment
A decline of 29% for Vechain price over three days finally overcame the persistent support of the channel’s lower trend line. Market observers are attributing yesterday’s definitive break in VET to the contagion associated with Elon Musk’s announcement that Tesla would not accept Bitcoin as payment due to his concerns over the environmental impact of mining.
A closer examination of the VET charts reveals that the rebound from the April 23 low into the May 7 high was corrective, not showing any days with impulsive price action or signs of accumulation in the volume profile. If the digital token had tremendous value, it would not have responded to the sharp sell-off in April with a gradual ascent. Instead, it would have rebounded as quickly as it fell.
VeChain price now is the final leg of an ABC correction with a measured move target of $0.120, or a 30% decline from price at the time of writing. It is based on the 54% decline from the April 17 high at $0.282 to the April 23 low at $0.128 (Point A). A similar drop of 54% from the May 7 high at $0.260 (Point B) would equal the measured move target of $0.120 (Point C).
The anticipated low will slightly undercut the April 23 low at $0.128, knocking out the lingering weak holders holding VET since the April high. An acceleration in the selling pressure could drive VeChain price down to the 38.2% Fibonacci retracement of the rally that began at the beginning of 2021 at $0.108.
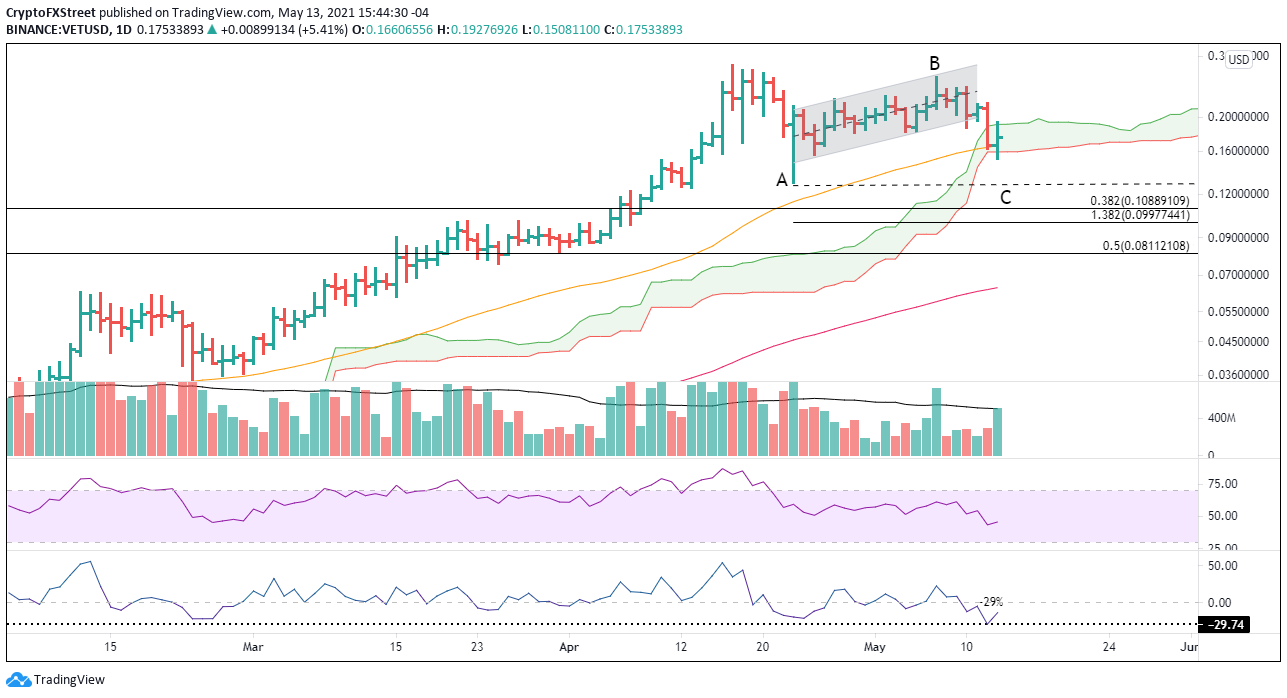
VET/USD daily chart
As long as VeChain price holds the intersection of the 50-day SMA and Ichimoku cloud, it is crucial to consider the bullish alternative. The potential exists that the decline below the channel was sufficient to release the weak holders and that other traders are capitalizing on the support mentioned above to accumulate VET.
The only pertinent upside targets for VET are Point B at $0.260 and then the all-time high at $0.282.
Author

Sheldon McIntyre, CMT
Independent Analyst
Sheldon has 24 years of investment experience holding various positions in companies based in the United States and Chile. His core competencies include BRIC and G-10 equity markets, swing and position trading and technical analysis.


