Uniswap Technical Analysis: UNI upswing to $2.6 hits the takeoff threshold
- UniSwap resumes the uptrend, but stalls under $2.5 as consolidation creeps in.
- The buying pressure is mainly from the whales holding over 10 million UNI; more upside action is expected.

UniSwap managed to come out of an extended downtrend, following the establishment of support at $2.2. The consistent breakdown affected all the projects in the decentralized finance (DeFi) ecosystem, which raised questions of a bubble or the lack of sustainability. Meanwhile, Uniswap appears to have woken up in tandem with Bitcoin's majestic price action and other selected large altcoins like Ethereum.
Uniswap price turning around after bullish breakout, whales on the rise
The formation of a descending wedge pattern on the 4-hour chart towards the end of October brought to light a declining downward momentum. For this reason, buying orders increased significantly over the weekend, which forced UNI upwards.
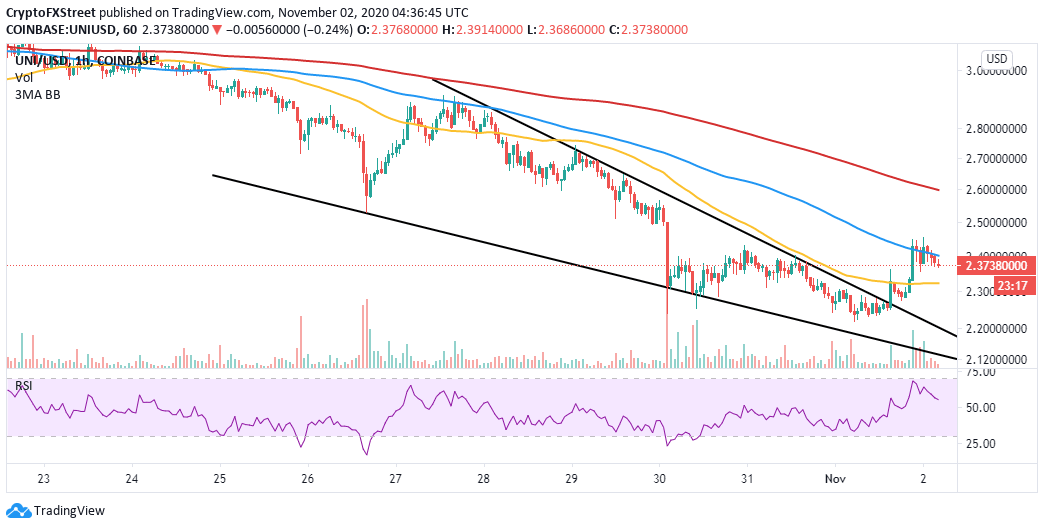
UNI/USD 4-hour chart
The breakout above the wedge pattern added credence to the momentum, leading to gains past the 100 Simple Moving Average (SMA) and the 50 SMA in the 4-hour timeframe. The bulls eyed the barrier at $2.5, but the moment started to lose steam.
At the time of writing, Uniswap is trading at $2.4 while dealing with the resistance highlighted by the 100 SMA. If this immediate seller congestion zone flips into support, UNI/USD would resume the uptrend and even shift the focus to the 200 SMA at $2.6.
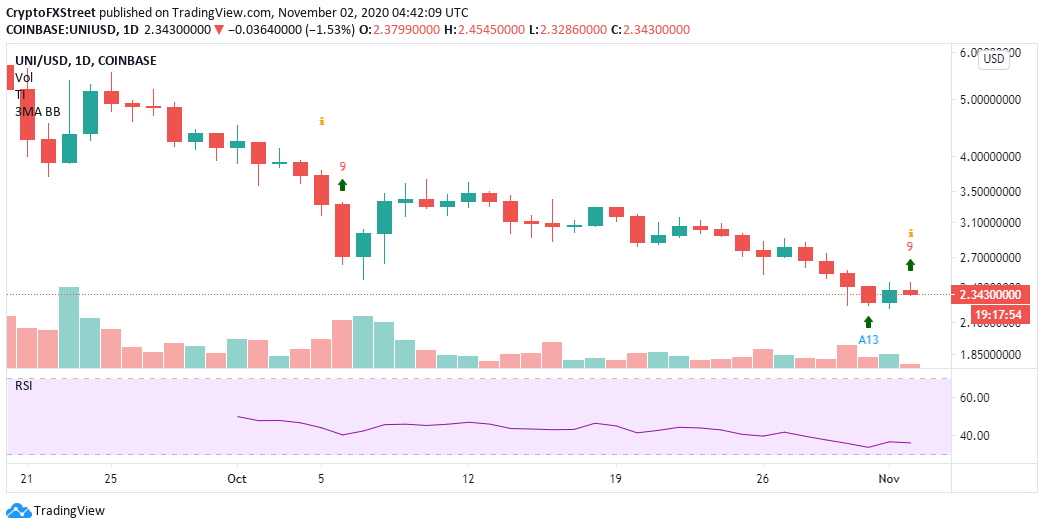
UNI/USD daily chart
The TD Sequential indicator's buy signal in the form of a red nine candlestick on the daily chart has added weight to the bullish narrative. In other words, the stalled price action could be a temporary delay ahead of the rally, first to $2.6 and then to $3.0. On the other hand, a levelling Relative Strength Index (RSI) suggests that consolidation will take precedence before the anticipated breakout.
Consequently, Santiment's holder distribution metric brings to light the earlier mentioned rise in buying pressure. For instance, the number of addresses holding more than 10 million UNI has increased from 16 on October 18 to 19 on November 2.
The small entrance number of these large investors may seem insignificant, but their impact should not be underestimated, as they move a big volume of coins. Therefore, if the addresses continue growing, Uniswap will eventually sustain the uptrend.
 [08.02.59, 02 Nov, 2020]-637398917188172465.png)
Uniswap holder distribution chart
Looking at the other side of the picture
IntoTheBlock's IOMAP model reveals a challenging resistance zone ahead of UNI. The seller congestion between $2.4 and $2.5 is brought about by the 89 addresses that previously purchased nearly 10.6 million UNI.
-637398918115626508.png)
Uniswap IOMAP chart
Rejection from this barrier is likely to send Uniswap to the initial support highlighted from $2.3 to $2.4. Here, 35 addresses previously purchased 4.1 million UNI. Bulls must guard this zone dearly because price action beneath it might send UNI back to the drawing board at $2.2.
Author

John Isige
FXStreet
John Isige is a seasoned cryptocurrency journalist and markets analyst committed to delivering high-quality, actionable insights tailored to traders, investors, and crypto enthusiasts. He enjoys deep dives into emerging Web3 tren


