Uniswap Technical Analysis: UNI bulls aggressively fight for an upswing to $3.5
- Uniswap bounces off support at $2.5 as bulls work around the clock to regain control.
- UNI/USD must break the descending channel middle layer resistance for gains above $3.

Uniswap recently revisited the crucial and robust support at $2.5 amid declines within a descending parallel channel. At the beginning of August, the recovery staged hit a barrier at $3.5, cutting short the bullish outlook.
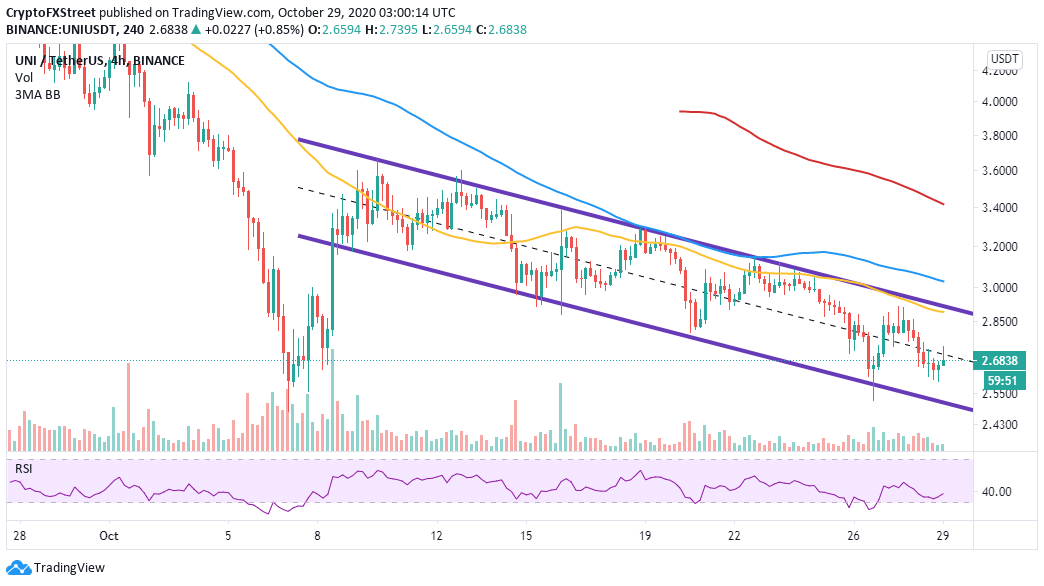
The channel support was instrumental in mitigating the extent of the bearish grip despite the downtrend. After bouncing off support at $2.5, UNI/USD is fighting to rise above the channel's middle boundary.
Meanwhile, Uniswap is teetering at $2.7 amid the bullish building momentum. The Relative Strength Index (RSI) gives credence to the potential upswing following a change in its direction slightly above the oversold area.
UNI/USD 4-hour chart
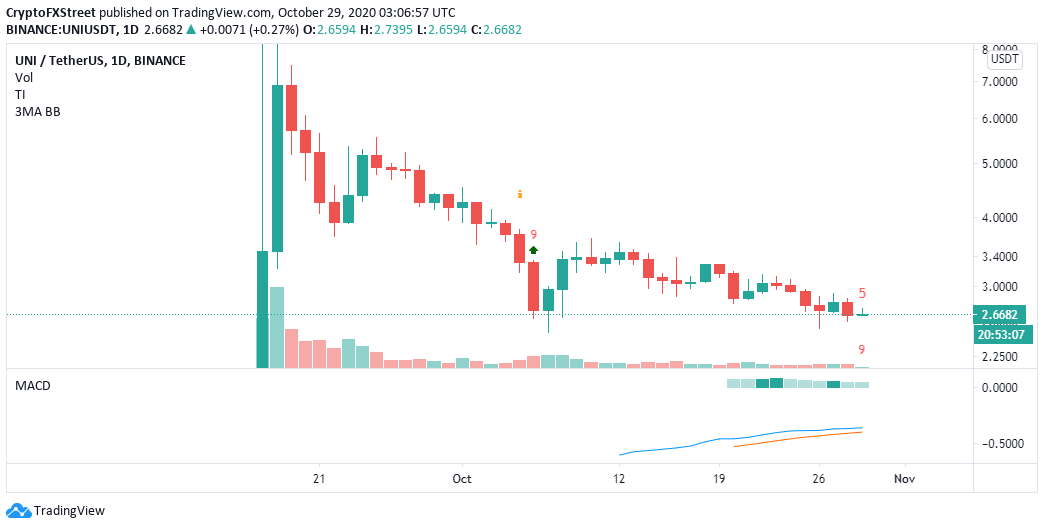
The bullish narrative is validated by the TD Sequential indicator's buy signal on the daily chart. Moreover, the Moving Average Convergence Divergence (MACD) shows that buyers are in control. If gains above $3.0 come into the picture, UniSwap will likely shift the focus to $3.5.
UNI/USD daily chart
Looking at the other side of the picture
IntoTheBlock's IOMAP reveals intensifying resistance ahead of UNI, which means that recovery to $3.5 may be delayed. For now, the most robust seller congestion zone is highlighted between $3 and $3.08. Here, nearly 6,600 addresses previously purchased approximately 52 million UNI.
Uniswap IOMAP chart
-637395391662415095.png)
On the downside, the absence of a substantial support area means Uniswap is not done with the downside and could resume the downtrend in the near term. Nonetheless, the model shines a light on the region running from $2.66 to $2.67 as the most dependable support area. Previously, 19 addresses bought nearly 427,000 UNI in this range.
Author

John Isige
FXStreet
John Isige is a seasoned cryptocurrency journalist and markets analyst committed to delivering high-quality, actionable insights tailored to traders, investors, and crypto enthusiasts. He enjoys deep dives into emerging Web3 tren


