Uniswap Price Prediction: UNI flashes buy signal targeting $3.3 in the short-term
- UNI is currently trading at $2.76 inside a descending parallel channel on the daily chart.
- The TD Sequential indicator presents a buy signal on the 3-day chart.

Uniswap continues trading in a downtrend and inside the daily descending parallel channel. The digital asset is slowly approaching the bottom at $2.7 while bulls try to push it above the upper trendline.
UNI eying up a breakout above $2.9 to hit $3.3
The price is currently right in the middle of the pattern. Bulls seem to have the upper hand after the TD Sequential indicator presented a buy signal on the 3-day chart. Uniswap looks ready for a rebound after weeks of downside action.
UNI/USDT 3-day chart
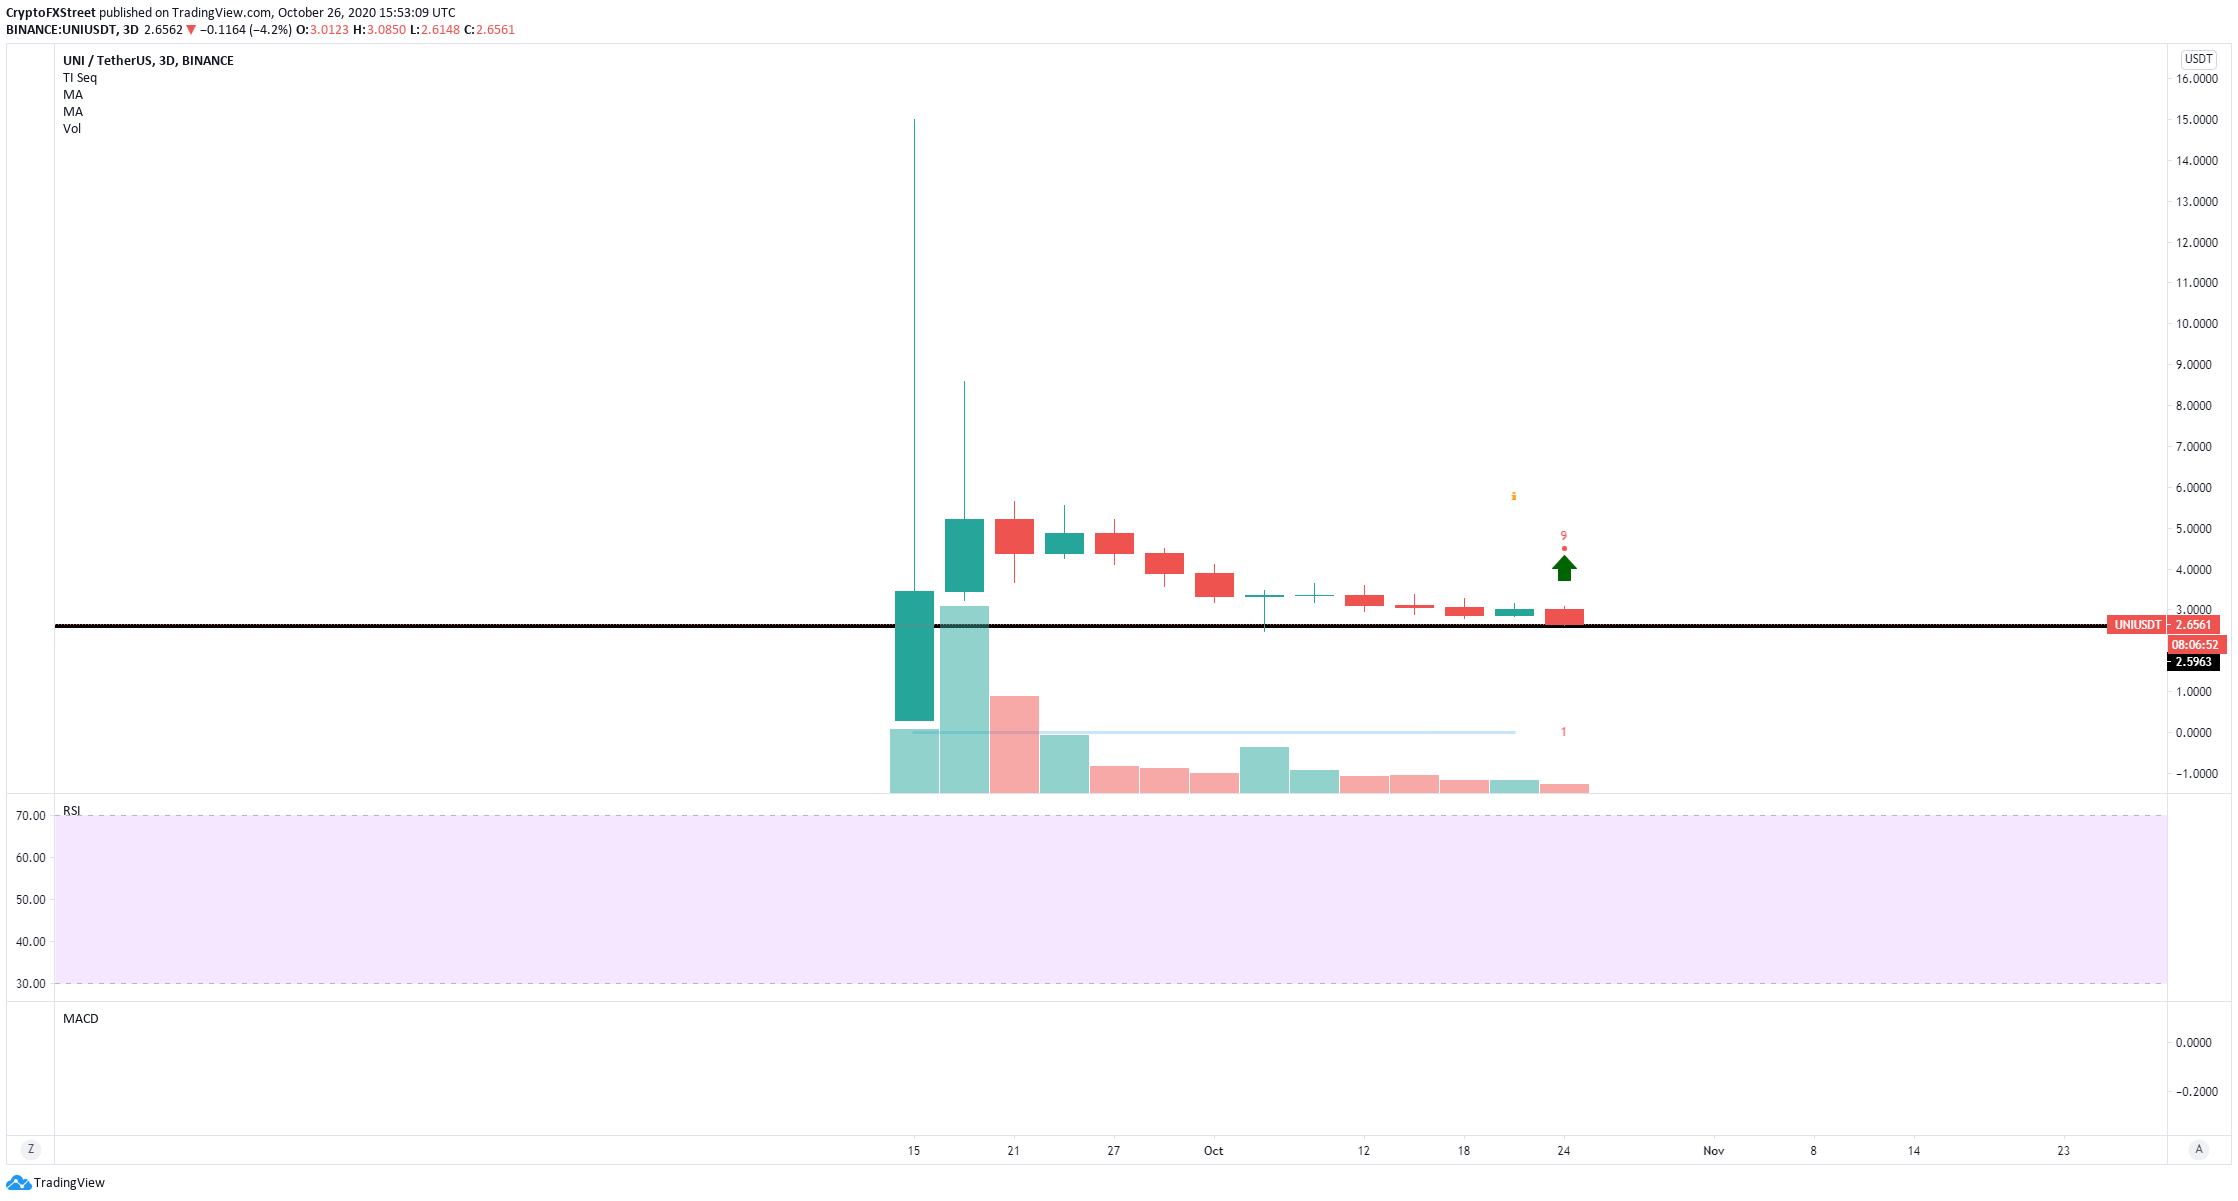
The TD Sequential indicator just presented a buy signal on the 3-day chart. The signal could confirm the theory that UNI is poised for a breakout above the descending parallel channel on the daily chart. Validation of this signal could take several days to happen.
UNI/USDT daily chart
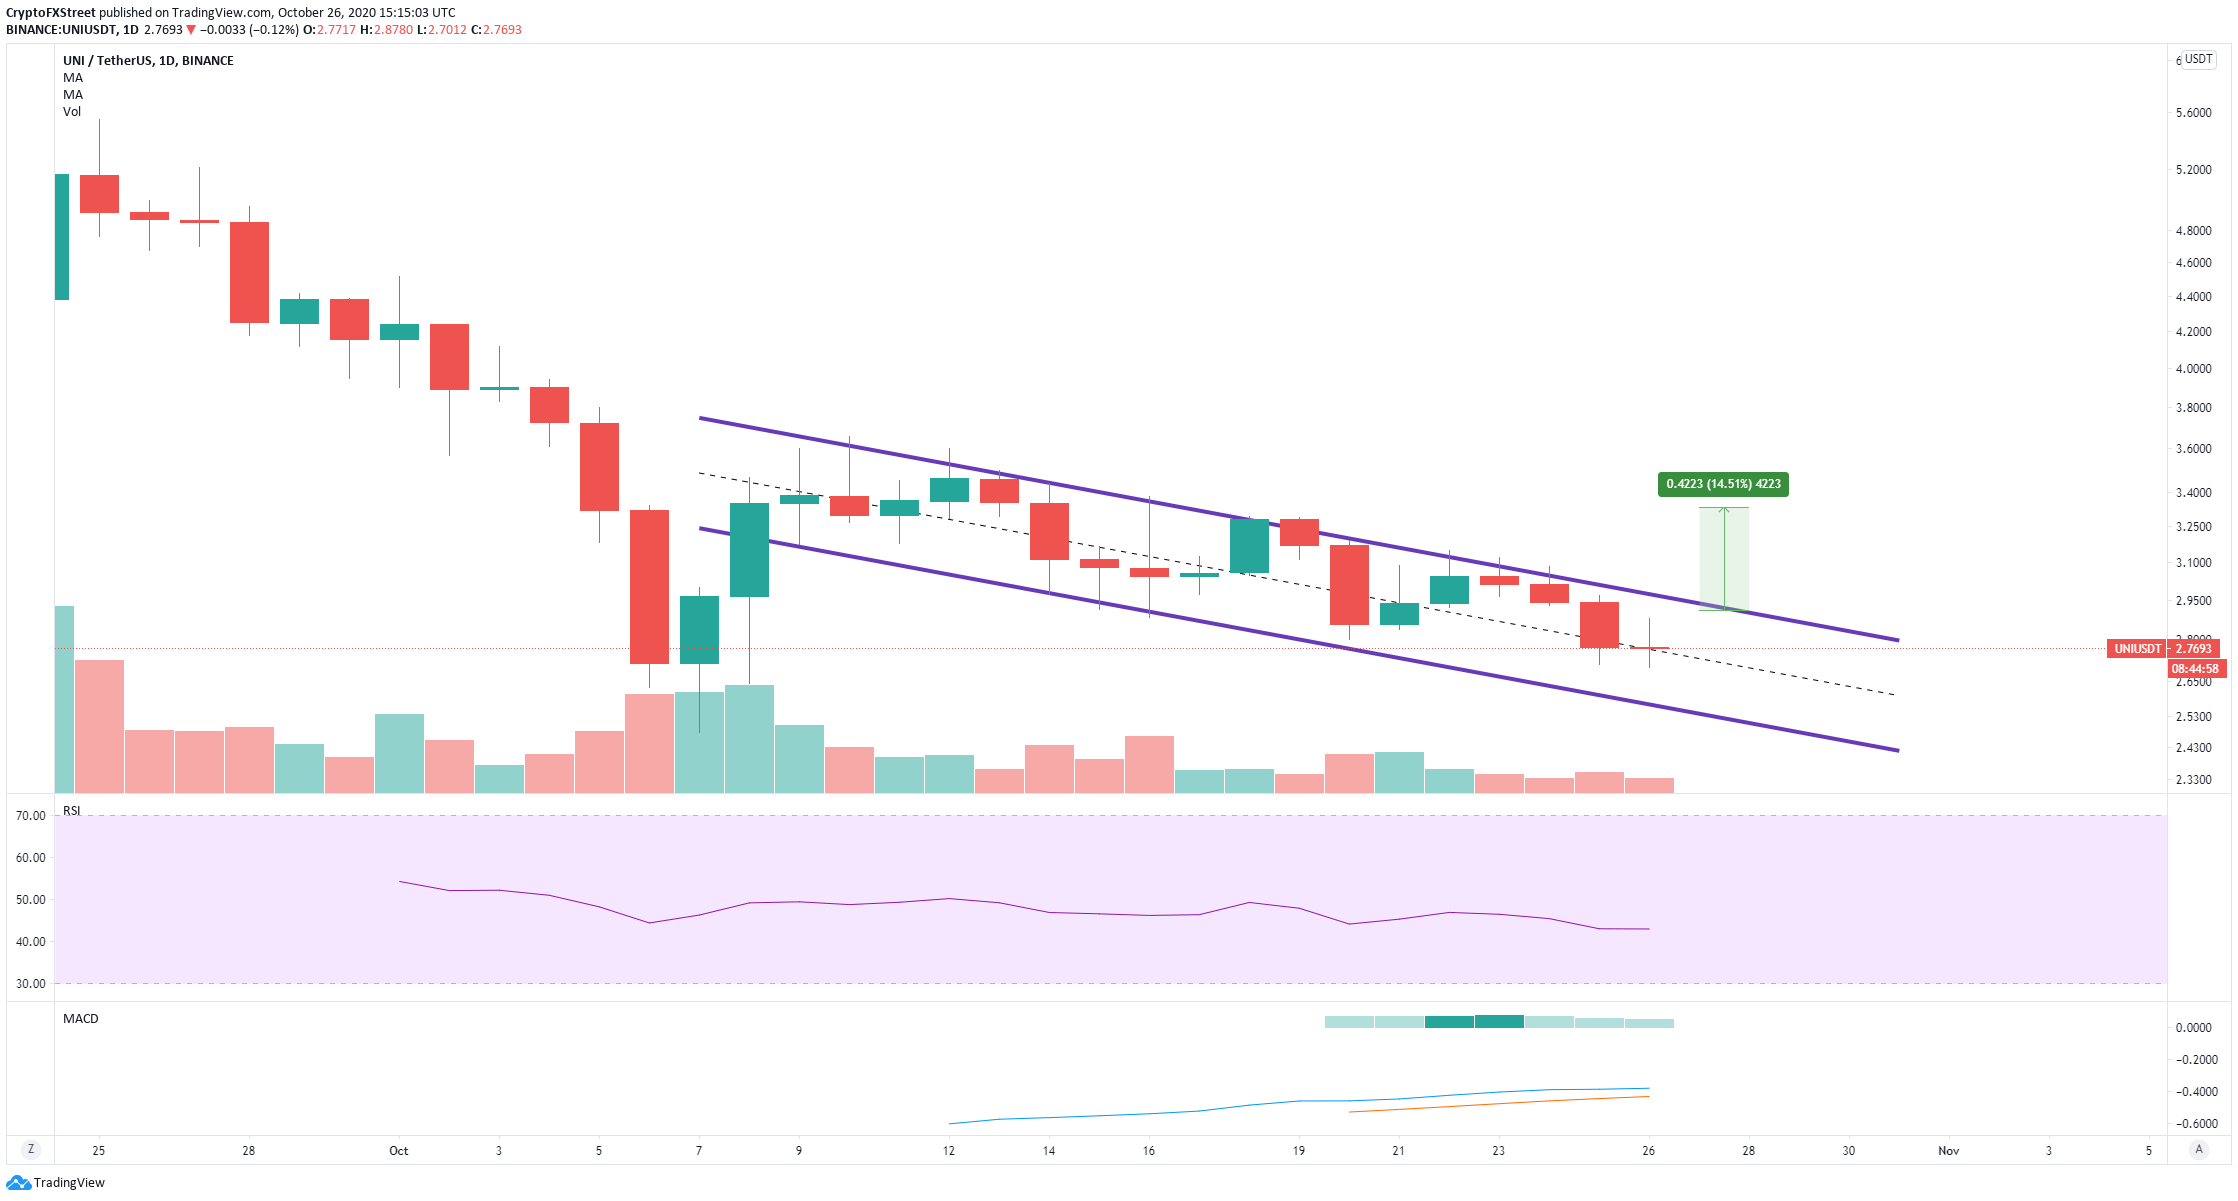
The most crucial pattern on the daily chart is the descending parallel channel established on October 8. On the daily chart, the MACD has remained bullish since October 20, and the RSI is not overextended. A breakout above the resistance at $2.9 would be notable and can easily drive UNI towards $3.3.
Bears are still in control despite bullish signs
Nonetheless, it’s important to note that UNI’s downtrend is intact, and bears are in control over practically all time-frames. Additionally, the entire crypto market could be facing a period of consolidation in the next few days until the US presidential elections are settled.
UNI/USDT 4-hour chart
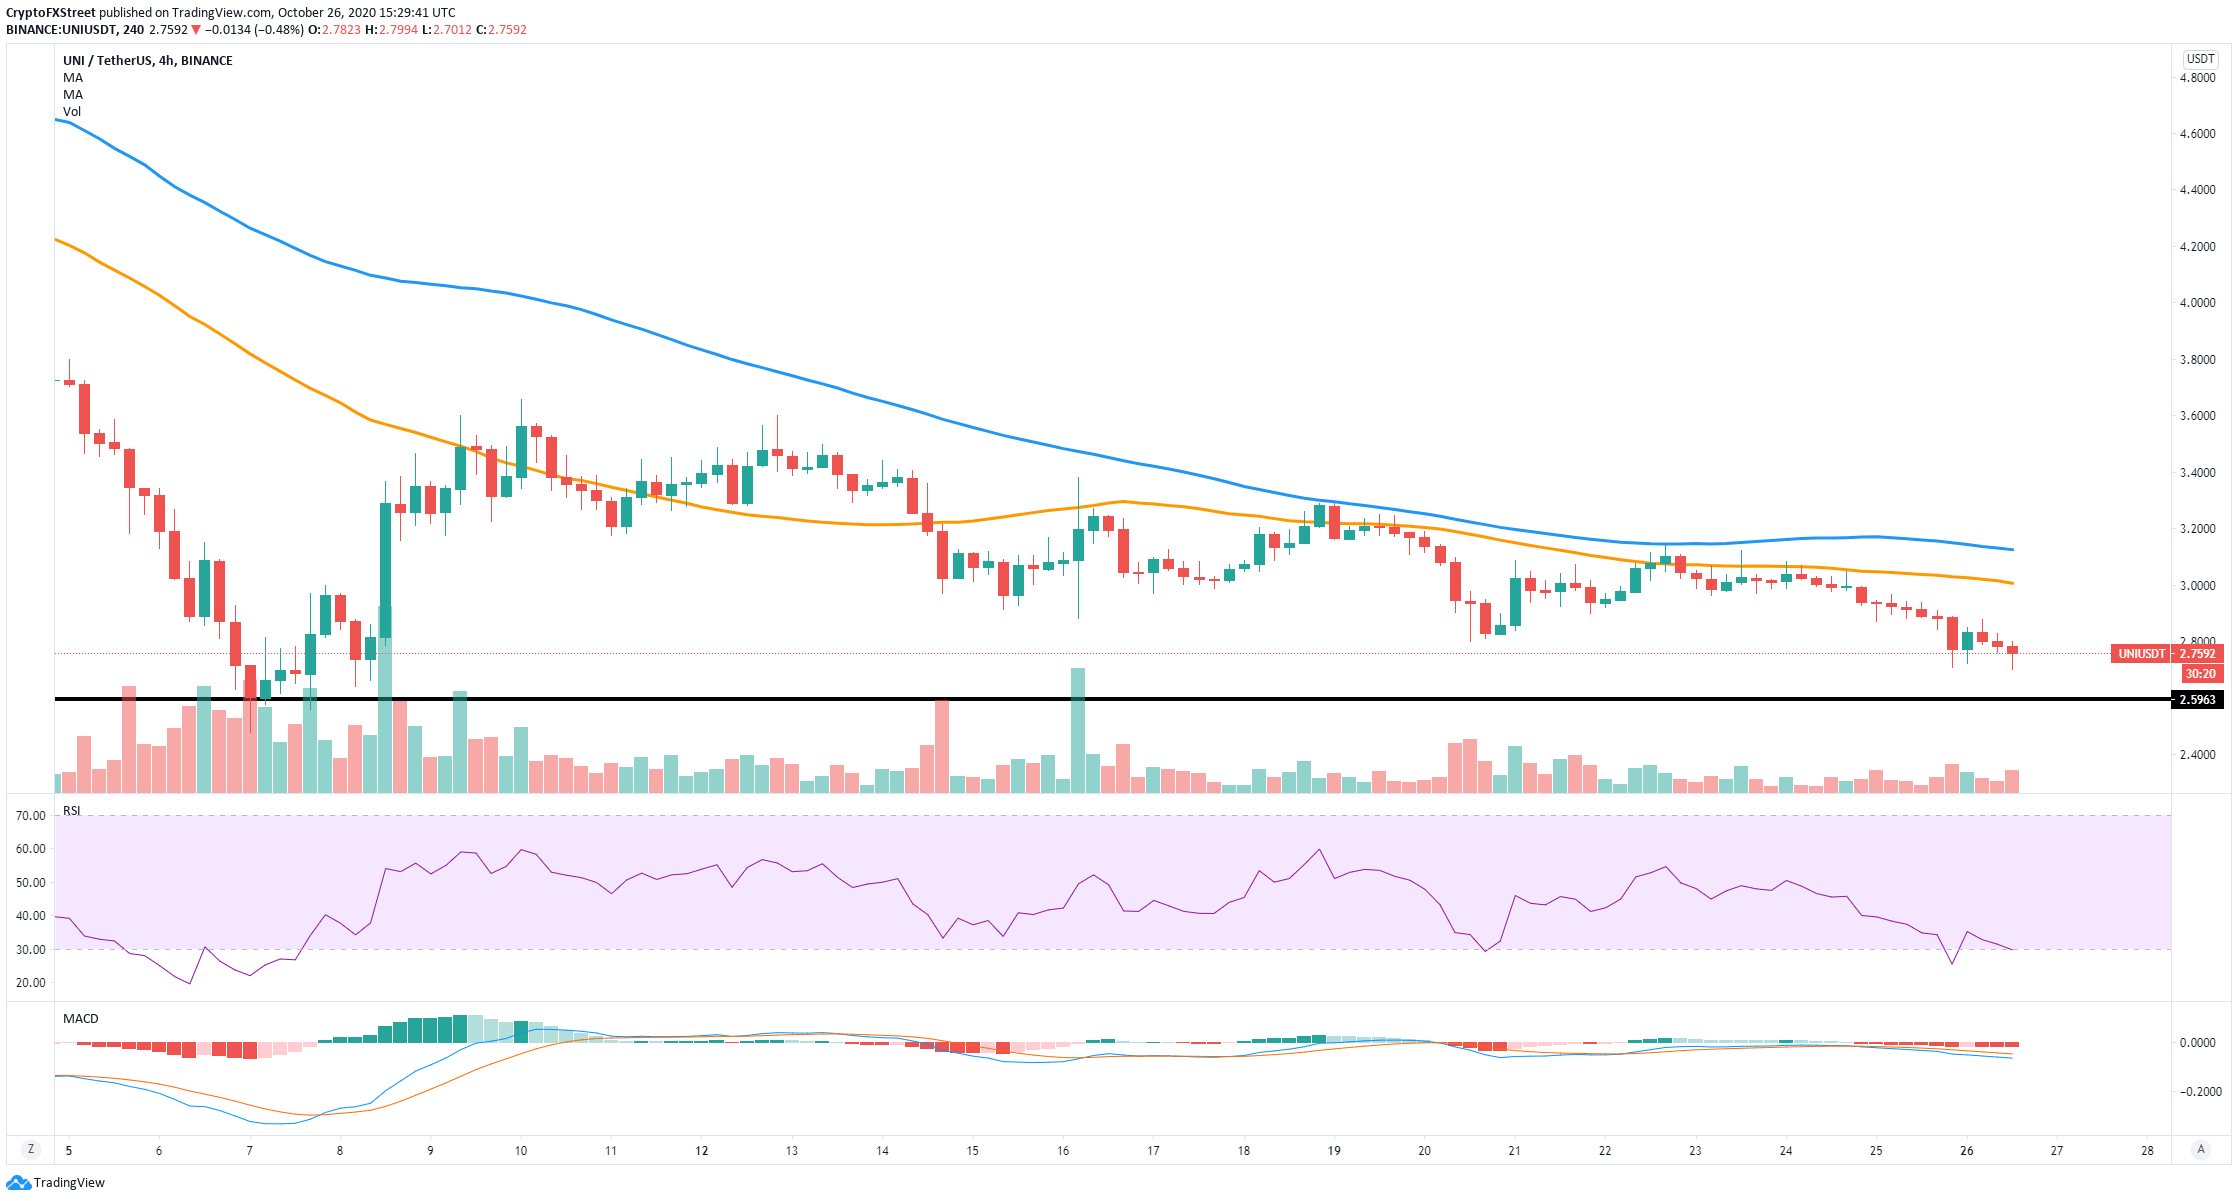
Bulls managed to confirm an uptrend on October 22 but quickly lost it only two days later. The MACD is bearish and gaining momentum. The last low at $2.7 is the nearest support level before $2.6. A bearish breakout below this point can drive UNI towards the psychological level at $2.
Author

Lorenzo Stroe
Independent Analyst
Lorenzo is an experienced Technical Analyst and Content Writer who has been working in the cryptocurrency industry since 2012. He also has a passion for trading.


