Uniswap Price Forecast: UNI might pause before attempting to establish new highs at $39
- Uniswap price has surged nearly 30%, hitting new all-time highs.
- A climb to $39.12 might follow a minor retracement to the demand zone ranging from $34.03 to $32.38.
- UNI held on exchanges has reduced by 9.5%, hinting at an overall bullish outlook.

Uniswap price has seen a massive spike in bullish momentum over the last 24 hours, which has allowed it to scale to record levels after consolidation for an extended period.
Uniswap price pauses as it approaches supply barrier
Uniswap price has seen a significant increase in the last 24 hours, which has resulted in a 30% upswing to new all-time highs at $38.34. Now, UNI is trading around the middle line of an ascending parallel channel awaiting buyers’ resurgence.
This technical formation is obtained by connecting the higher highs and higher lows formed from February 20 to date using trend lines. Although this is a bearish pattern, UNI’s price action seems to be contained within this channel. Only a breakdown of the setup’s lower range could trigger a bearish outlook.
Uniswap price is likely to head toward this setup’s upper boundary at $48.06 after a retracement to the demand zone ranging from $34.03 to $32.38. However, the resistance level at $39.12 could deter this upward move.
Adding credence to this bullish thesis is the recently spawned buy signal from the SuperTrend indicator.
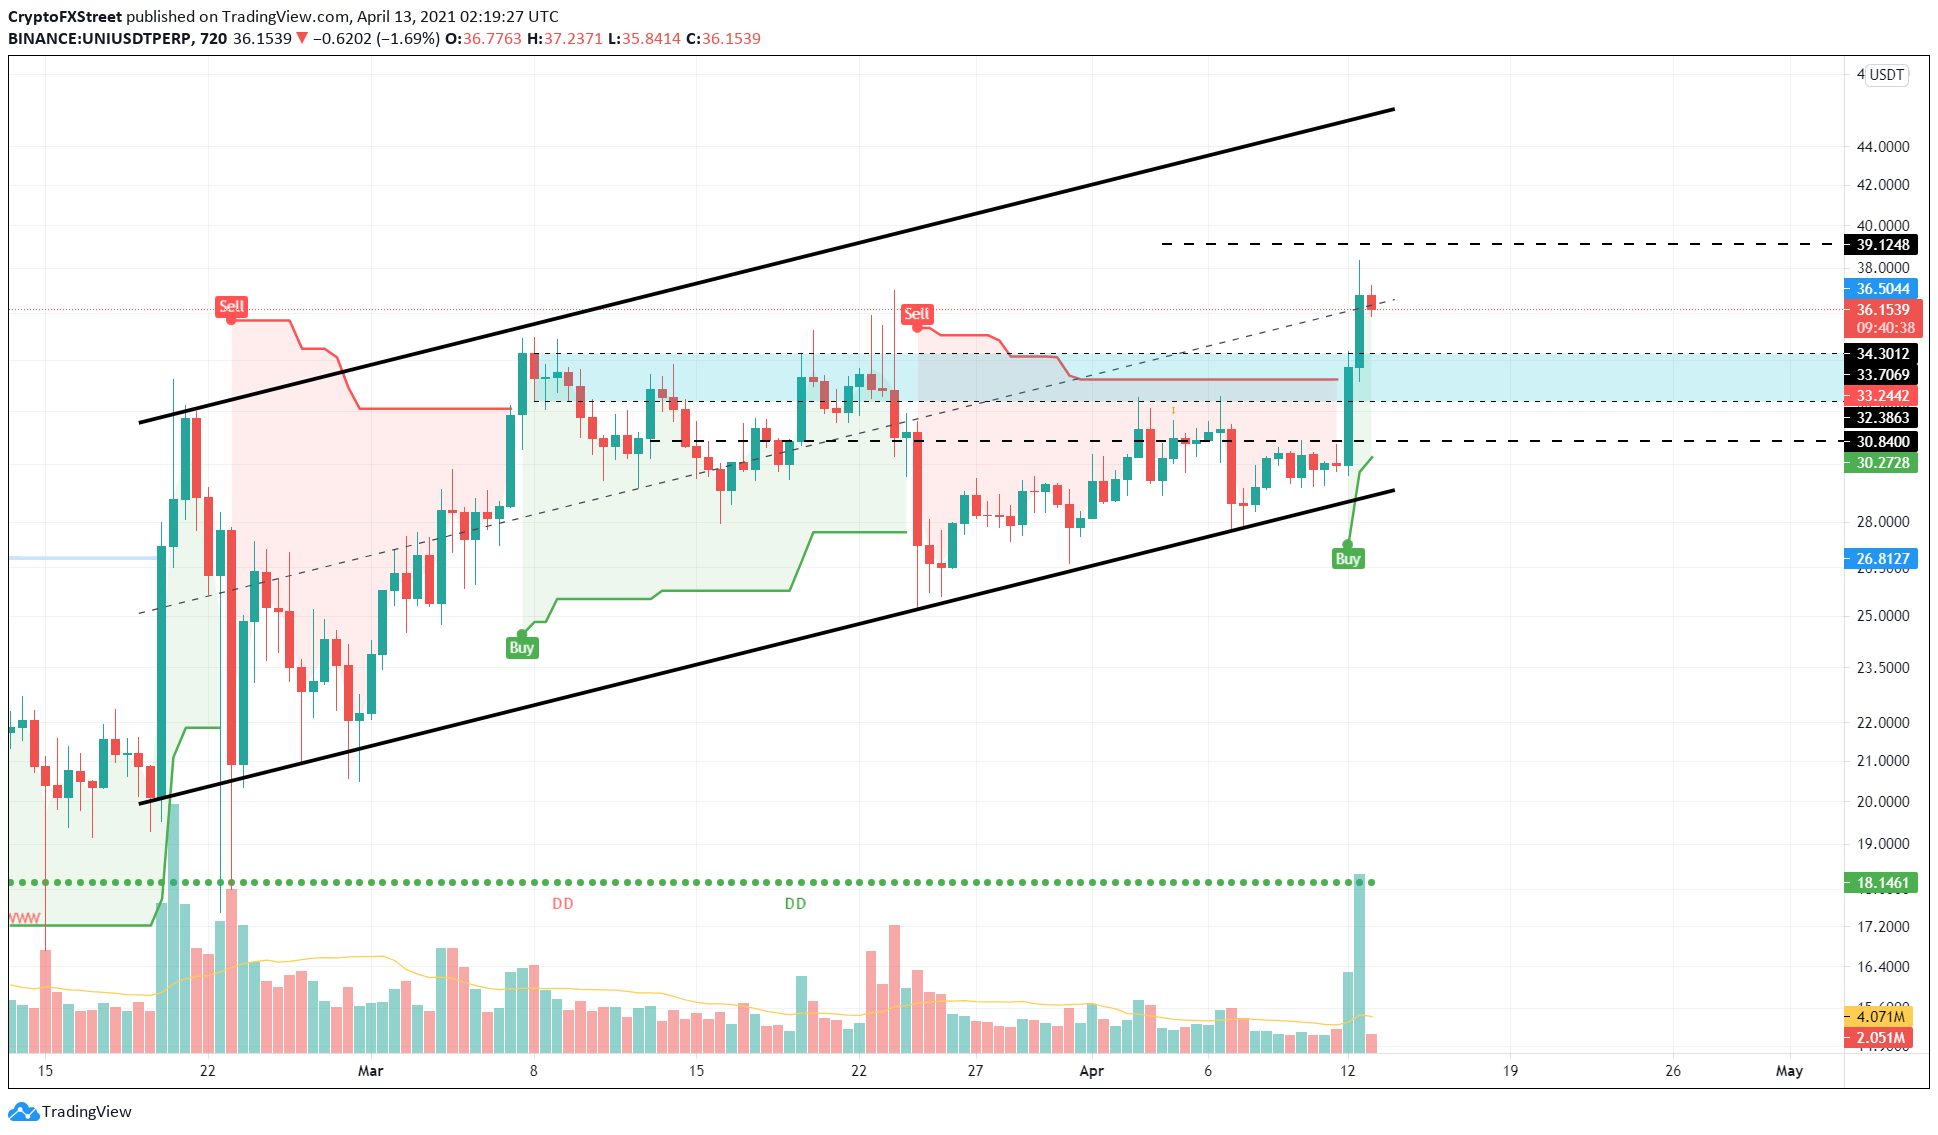
UNI/USDT 12-hour chart
Supporting the bullish narrative is IntoTheBlock’s In/Out of the Money Around Price (IOMAP) model, which shows no resistance ahead for the DeFi coin.
Moreover, small clusters of support barriers exist up to $30.84. Hence, a short-term spike in selling pressure might see a bounce from this level.
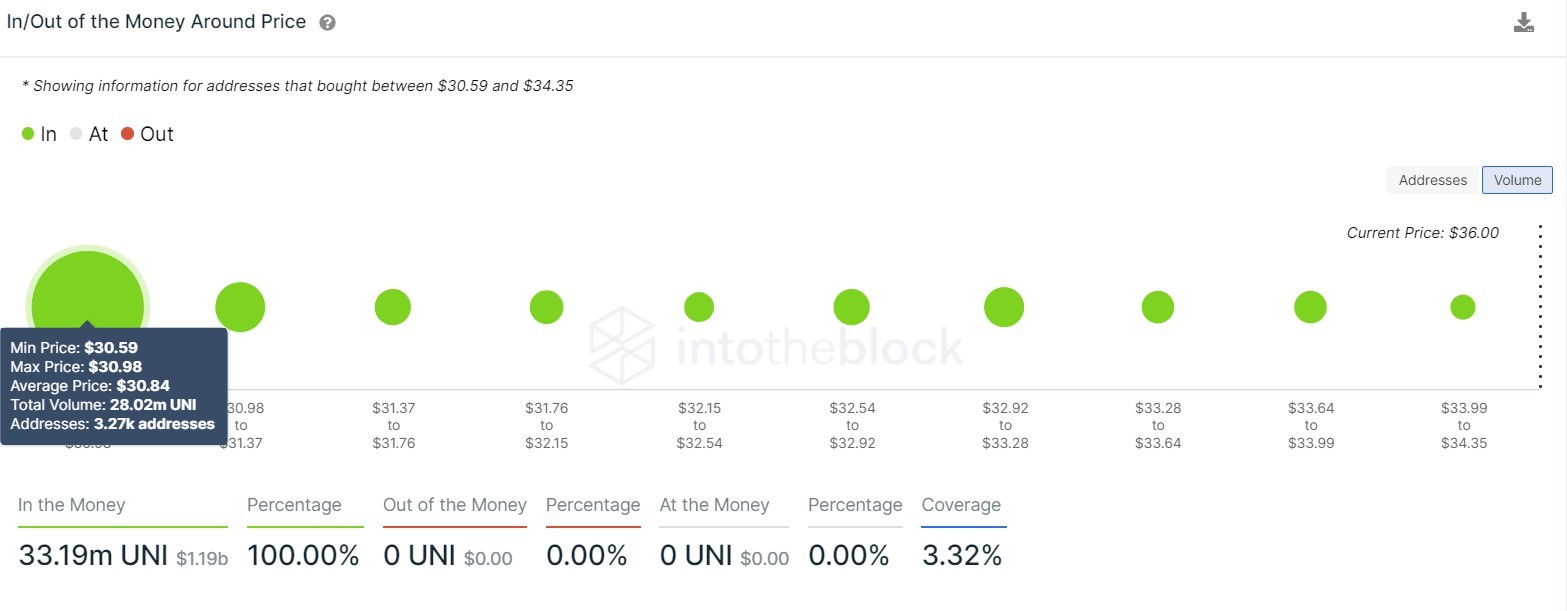
Uniswap IOMAP chart
The daily active addresses have risen from 3,919 to 7,343 in the last 24 hours, representing ballooning investor activity and user adoption. Therefore, this 87% rise paints a bullish picture for UNI.
While there is a short-term spike in sellers, the number of UNI held on exchanges as a percent of total supply has seen a 9.5% drop from 6.9% to 6.1%. This reduction suggests that investors are optimistic about Uniswap price in the long run.
%20[09.04.03,%2013%20Apr,%202021].png)
Uniswap daily active addresses and supply on exchanges chart
All in all, the outlook for Uniswap appears to be bullish, with a healthy spike in crucial on-chain metrics. However, if the sellers push the UNI price below the lower range of the demand zone at $32.38, it could spell disaster for the DeFi coin.
IOMAP cohorts reveal that the Uniswap price could retrace 5% to a crucial support barrier at $30.84, coinciding with the channel’s lower boundary. Here, roughly 3,300 addresses hold nearly 28 million UNI tokens and are likely to absorb the selling pressure.
However, if the sellers continue to persist, the bears could push UNI to the 61.8% Fibonacci retracement level at $27.91.
Author

Akash Girimath
FXStreet
Akash Girimath is a Mechanical Engineer interested in the chaos of the financial markets. Trying to make sense of this convoluted yet fascinating space, he switched his engineering job to become a crypto reporter and analyst.



