Uniswap price goes from one bearish pattern to another
- Uniswap price triggers head-and-shoulders top pattern.
- 50-day simple moving average (SMA) providing support for 15 days.
- Neo-bank Revolut now listing UNI on their platform for trading.

Uniswap price has failed to appreciate with many of the other cryptocurrencies since the late-March lows. Instead, UNI resolved an ascending wedge pattern to the downside, and the price action over the last fifteen days has shaped the right shoulder of a head-and-shoulders top pattern, carrying bearish near-term implications.
Uniswap price suggests that it may be losing the Battle of DEXes
Yesterday, the London-based neo-bank Revolut announced it had added the option for customers to buy and sell 11 more tokens, including Uniswap. Others added to the list are Cardano, Filecoin, and The Graph.
On the competition front, UNI is being confronted by a faster and cheaper alternative, PancakeSwap. PancakeSwap is a decentralized exchange like Uniswap, and detailed code analysis shows it is a virtual copy of UNI. Ethereum maxis have called the platform a rip-off, but proponents of open source code say it’s all fair.
A myriad of things could undermine UNI’s participation in the broader cryptocurrency rally, but the technicals speak with a bearish tone. On Wednesday, the token triggered the head-and-shoulders top but quickly found some support at the 50-day SMA at $28.52. However, the pattern remains active as long as the price does not rally above the right shoulder at $32.43.
The 38.2% retracement of the entire rally from the November 2020 low at $23.46 is the first prominent support, followed by the 100-day SMA at $20.95. Critical support surfaces at the confluence of the head-and-shoulders top measured move target at $19.57 and the 61.8% retracement level at $19.32.
There is more support around the February lows between $17.10 and 17.15. A failure to hold will lead to massive losses.
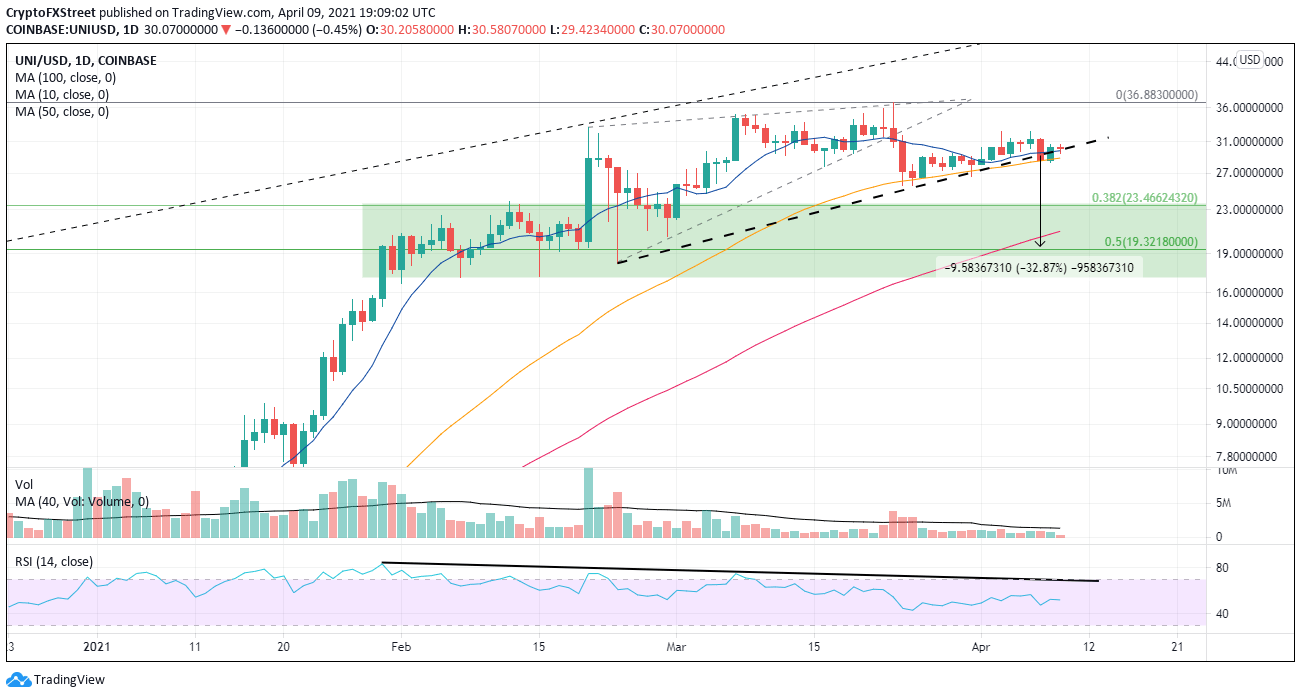
UNI/USD daily chart
A rally above $32.43 will void the head-and-shoulders top pattern and will likely lead to a test of the all-time high at $36.83. A close above the high could unleash a new phase for the rally that could test the topside trendline at $50.60.
Author

Sheldon McIntyre, CMT
Independent Analyst
Sheldon has 24 years of investment experience holding various positions in companies based in the United States and Chile. His core competencies include BRIC and G-10 equity markets, swing and position trading and technical analysis.




