Uniswap is poised for a rally on triangle breakout and positive on-chain metrics
- Uniswap broke above the ascending triangle pattern, eyeing a rally ahead.
- Artemis data shows UNI’s daily active addresses have reached a new all-time high.
- On-chain paints a bullish picture, as UNI’s Exchange Flow Balance shows a negative spike.
- A daily candlestick close below $6.30 would invalidate the bullish thesis.

Uniswap (UNI) trades around $7 on Friday after rallying 8.5% and breaking above the ascending triangle pattern on Thursday. This bullish breakout is further supported by UNI’s daily active addresses, which have reached a new all-time high and Exchange Flow Balance, which shows a negative spike, all hinting at an upcoming rally.
Uniswap is set for an upswing after breaking above the ascending triangle pattern
Uniswap price broke and closed above the ascending triangle formation on Thursday and rallied 8.5%. This pattern was created by drawing two trendlines from August 2, connecting swing points on the daily chart between two higher lows and multiple equal highs. This technical pattern breakout favors the bulls, and the target is generally obtained by measuring the distance between the first daily high and the first daily low to the breakout point. At the time of writing on Friday, it trades slightly higher, around $7.38
If the breakout level is retested and support is found around the weekly resistance at $7.06, UNI could rally 35% to retest its technical target at $9.38. Investors should be cautious of this theoretical move as it could face a slowdown at Uniswap’s daily resistance level of $8.19 and could book some profits at $8.19.
The Relative Strength Index (RSI) on the daily chart trades above its neutral level of 50 and points upwards at 63. A cross to levels above 60 generally indicates bullish momentum is gaining traction. However, traders should be cautious as it approaches its overbought level at 70.
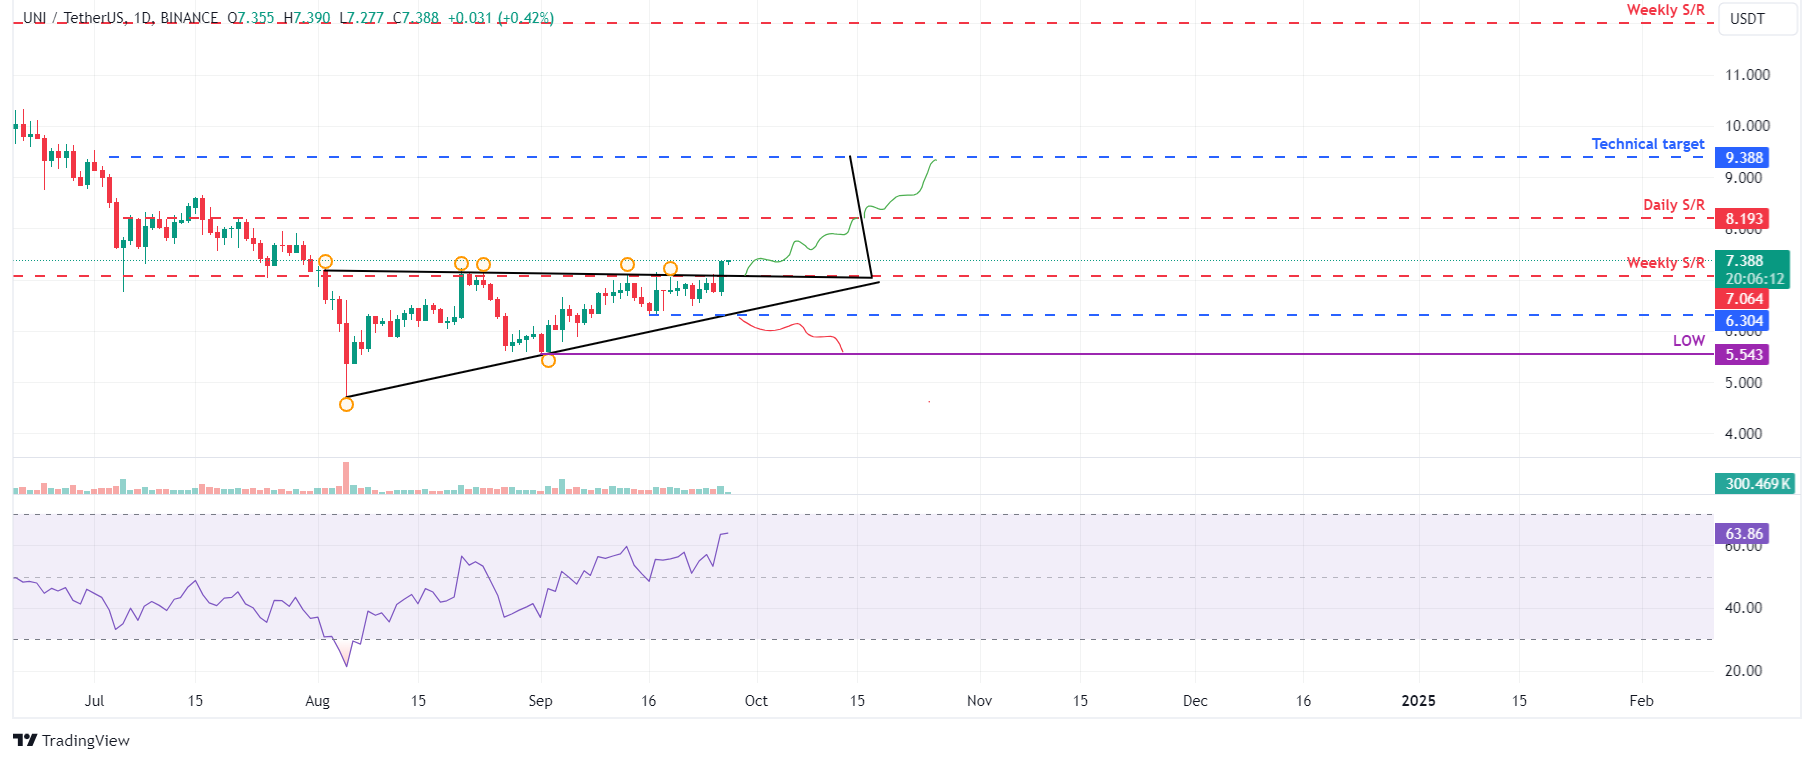
UNI/USDT daily chart
Artemis’s Daily Active Addresses data, which tracks network activity over time, paints a bullish picture for Uniswap. A rise in the metric signals greater blockchain usage, while declining addresses point to lower demand for the network.
In UNI’s case, Daily Active Addresses rose from 796,700 on September 4 to 1.5 million on September 20, reaching a new all-time high. This indicates that demand for Uniswap’s blockchain usage is increasing, which bodes well for Uniswap price.
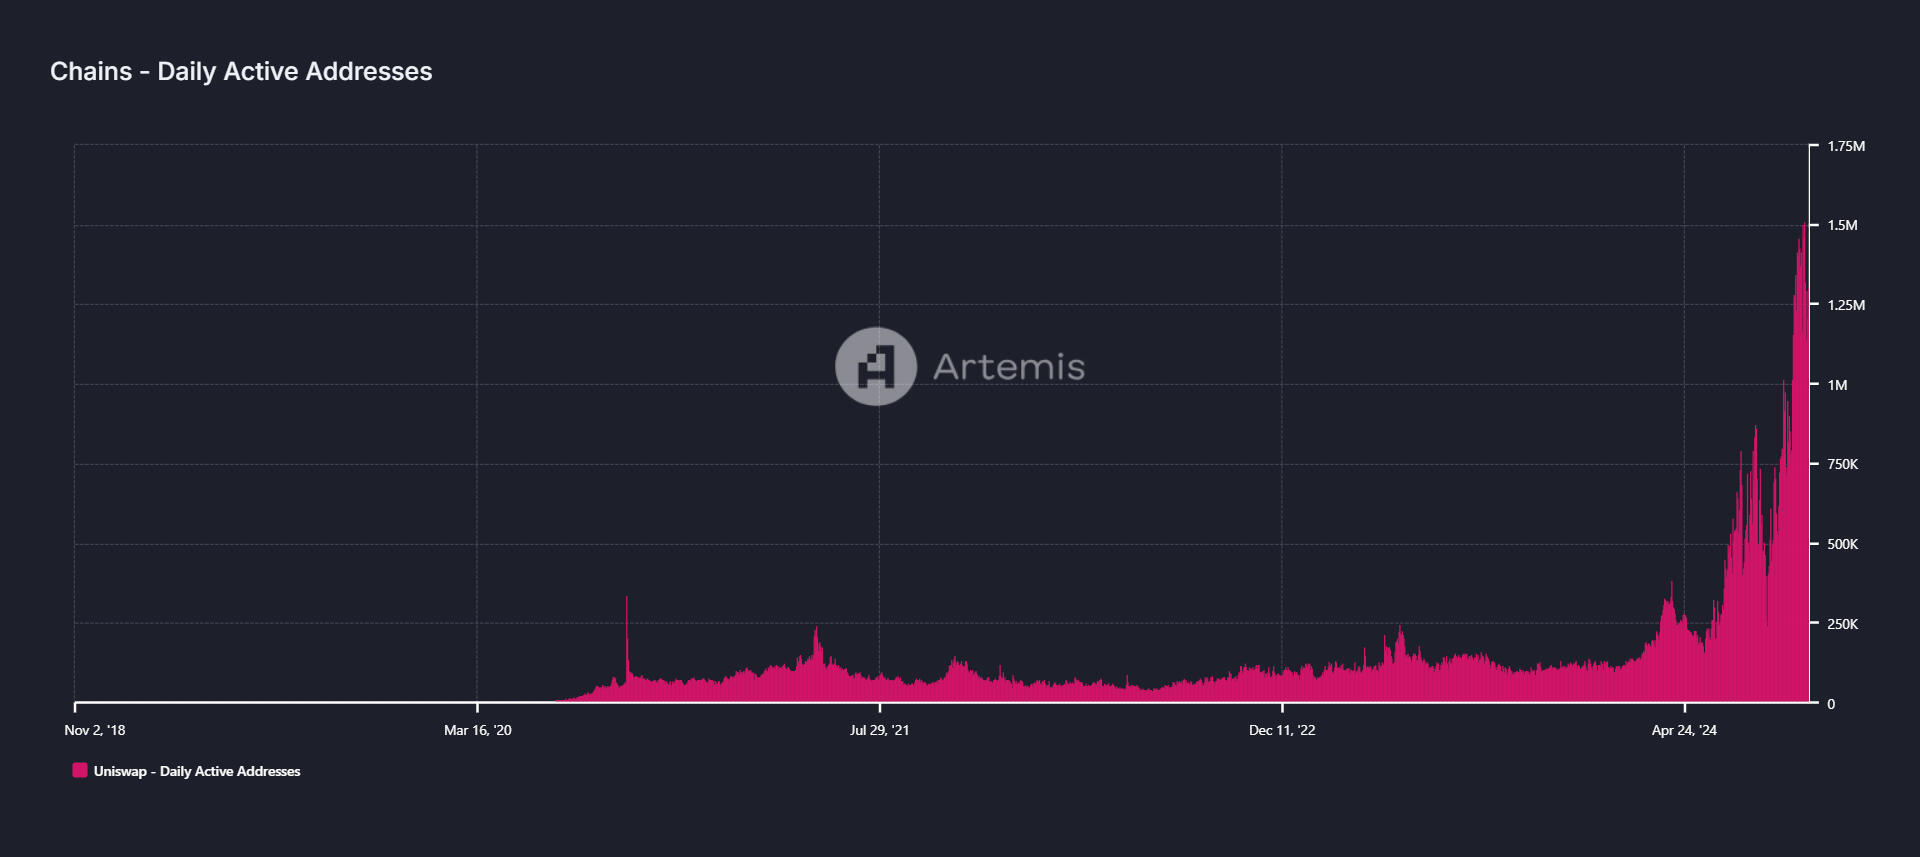
UNI Daily Active Addresses chart
Additionally, Santiment’s Exchange Flow Balance also projects bullish signs for Uniswap. This metric shows the net movement of Uniswap tokens into and out of exchange wallets.
A rise in this metric indicates more UNI has entered the exchanges than exited, hinting at selling pressure from investors. Conversely, a fall in the metric indicates that more UNI left the exchange than entered, indicating less selling pressure from investors.
In the case of UNI, this metric slumped from 321,030 to -2.06 million from September 17 to September 19. This fall indicates increasing confidence among investors as holders remove Uniswap tokens from exchanges and store them in cold wallets.
%20[09.34.33,%2027%20Sep,%202024]-638630138915502494.png)
UNI Exchange Flow Balance chart
However, the bullish thesis will be invalidated if the weekly support at $7.06 fails to hold and the Uniswap price declines and closes below the September 16 low of $6.30. This development would extend the decline by 11% to retest its September 1 low of $5.54.
Author

Manish Chhetri
FXStreet
Manish Chhetri is a crypto specialist with over four years of experience in the cryptocurrency industry.


