Uniswap price is poised for a rally if it breaks above the ascending triangle pattern
- Uniswap price is squeezed between the boundaries of an ascending triangle; a breakout signals a bullish move ahead.
- On-chain data shows a bullish bias as UNI’s Exchange Flow Balance is negative, and the exchange supply decreases.
- A daily candlestick close below $5.54 would invalidate the bullish thesis.

Uniswap (UNI) price trades inside an ascending triangle pattern; a breakout signals a rally ahead. This bullish move is further supported by UNI’s on-chain data, which shows a negative Exchange Flow Balance and decreasing exchange supply, hinting at a rally ahead.
Uniswap price looks set to resolve ascending triangle to the upside
Uniswap price has produced two higher lows and three roughly equal highs since August 2. Connecting these swing points using a trend line reveals an ascending triangle formation in the daily chart. This technical pattern has a bullish bias, and the target is generally obtained by measuring the distance between the first swing high and the first swing low to the breakout point. At the time of writing on Thursday, it trades 1.75% higher, inside the ascending triangle at $6.86.
Assuming the breakout happens by closing a daily candlestick above the weekly resistance at $7.06, adding the 35% measurement to the potential breakout level of $7.06 reveals a target of $9.38. Investors should be cautious of this theoretical move as it could face a slowdown at Uniswap’s daily resistance level of $8.19 and could book some profits at $8.19. However, since the Relative Strength Index (RSI) and Awesome Oscillator (AO) indicators on the daily chart are firmly above their respective neutral levels of 50 and zero, the possibility of a slowdown above is unlikely.
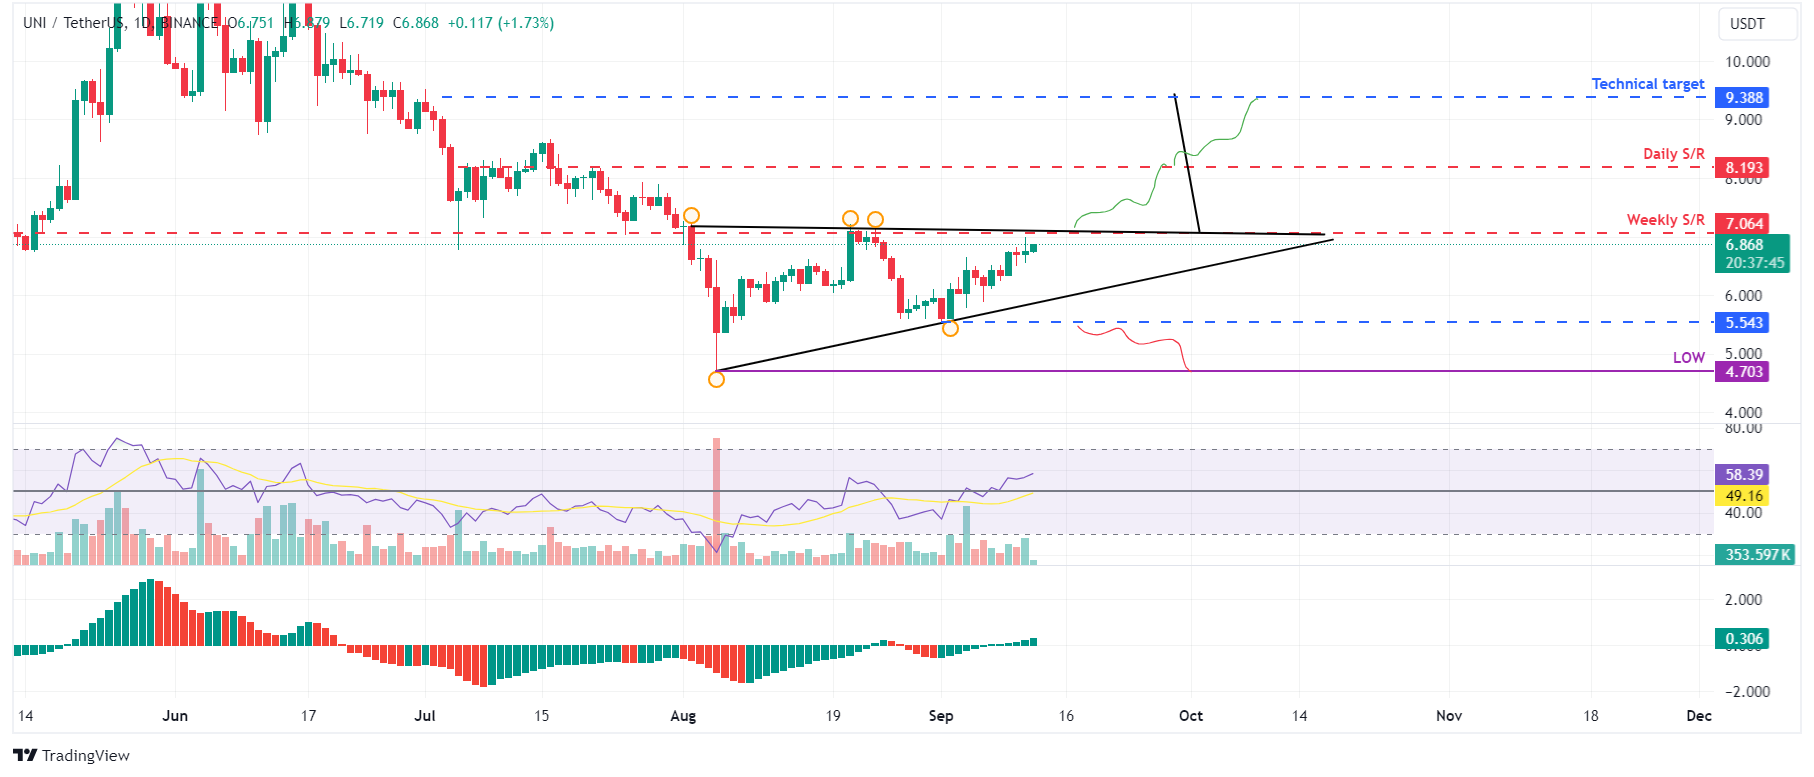
UNI/USDT daily chart
Santiment’s Exchange Flow Balance shows the net movement of Uniswap tokens into and out of exchange wallets. A positive spike indicates more tokens have entered than exited, suggesting selling pressure from investors. Conversely, a negative value indicates more tokens left the exchange than entered, indicating less selling pressure from investors and holders accumulating the asset.
In the case of UNI, this metric slumped from 12,250 to -1.85 million from September 4 to September 5 and from 7,015 to -1.05 million from Sunday to Monday. This negative shift indicates increased buying activity among investors.
During this event, the Uniswap Supply on Exchanges declined by 4.7%. This is a bullish development, as holders remove UNI from exchanges and hold it in cold wallets, further denoting investor confidence in Uniswap.
%20[08.19.20,%2012%20Sep,%202024]-638617108467985509.png)
Uniswap Exchange Flow Balance and Supply on Exchange chart
Despite the bullish thesis signaled by both on-chain data and technical analysis, if UNI breaks the upward trendline of the triangle and closes below $5.54, the outlook would shift to bearish. This scenario could lead to a crash of 16% to $4.70, a daily low of August 5.
Author

Manish Chhetri
FXStreet
Manish Chhetri is a crypto specialist with over four years of experience in the cryptocurrency industry.


