Uniswap Elliott Wave technical analysis [Video]
![Uniswap Elliott Wave technical analysis [Video]](https://editorial.fxstreet.com/images/Markets/Currencies/Cryptocurrencies/Uniswap/uniswap-150x150logo-637399982744667692.png)
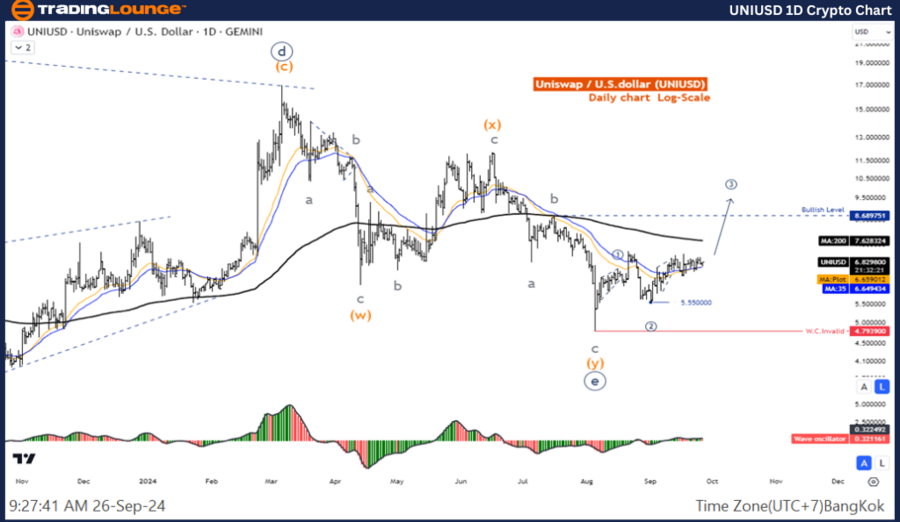
Elliott Wave Analysis TradingLounge Daily Chart.
UNI/USD Elliott Wave technical analysis
Function: Counter trend.
Mode: Counter.
Structure: Double Corrective.
Position: Wave (Y).
Direction next higher degrees: Wave ((E)) of Triangle.
Details: Movement within the Triangle pattern May is complete and the price increase again.
Uniswap/ U.S. dollar(UNIUSD)Trading Strategy: It looks like the wave ((E)) correction is complete and the price is still likely to move up. Look for an opportunity to join the uptrend.
Uniswap/ U.S. dollar(UNIUSD)Technical Indicators: The price is above the MA200 indicating an uptrend, The Wave Oscillator is a Bearish Momentum.
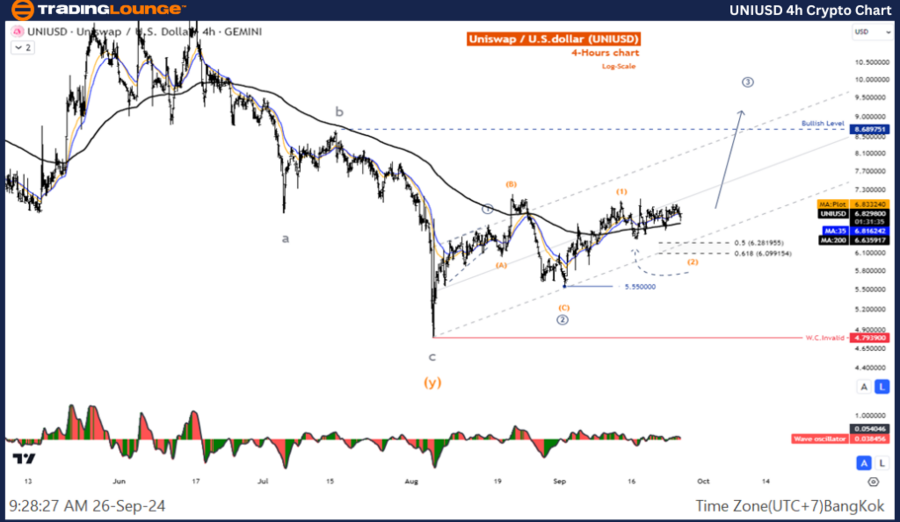
Elliott Wave Analysis TradingLounge H4 Chart.
UNI/USD Elliott Wave technical analysis
Function: Follow trend
Mode: Motive
Structure: Impulse
Position: Wave ((3))
Direction Next higher Degrees: Wave ((3)) of Impulse
Details: Wave 2 May is complete and the price increase again in Wave 3
Uniswap/ U.S. dollar(UNIUSD)Trading Strategy: It looks like the wave (2) correction is complete and the price is still likely to move up. Look for an opportunity to join the wave (3) uptrend.
Uniswap/ U.S. dollar(UNIUSD)Technical Indicators: The price is above the MA200 indicating an uptrend, The Wave Oscillator is a Bearish Momentum.
Uniswap Elliott Wave technical analysis [Video]
Author

Peter Mathers
TradingLounge
Peter Mathers started actively trading in 1982. He began his career at Hoei and Shoin, a Japanese futures trading company.


