Uniswap could face short-term correction on bearish divergence, rising supply on exchanges
- Uniswap price faces resistance at a weekly level of $12.01 and retraces more than 8% on Monday.
- On-chain data show that UNI’s supply on exchange is increasing, suggesting a potential local price top.
- Technical analysis shows that UNI has formed a bearish divergence on a momentum indicator.
- A daily candlestick close above $13.36 would invalidate the bearish thesis.

Uniswap (UNI) price encounters resistance near the weekly level of approximately $12 and retraces more than 8% on Monday. On-chain metrics indicate a rising supply on exchanges and declining development activity, hinting at a potential formation of a local top. Additionally, technical indicators show a bearish divergence on momentum indicators, signaling the possibility of a forthcoming downturn in Uniswap's price.
Uniswap price eyes for a downward correction
Uniswap price faces a rejection around the weekly resistance level of $12.01. If this resistance level holds, UNI price could crash 25% to tag $9.06, its daily support level.
The Relative Strength Index (RSI) and the Awesome Oscillator (AO) support this bearish thesis in the daily chart. The higher high in UNI’s price formed on June 16 does not reflect the RSI lower high for the same period. This development is termed a bearish divergence and often leads to the reversal of the trend or a short-term crash.
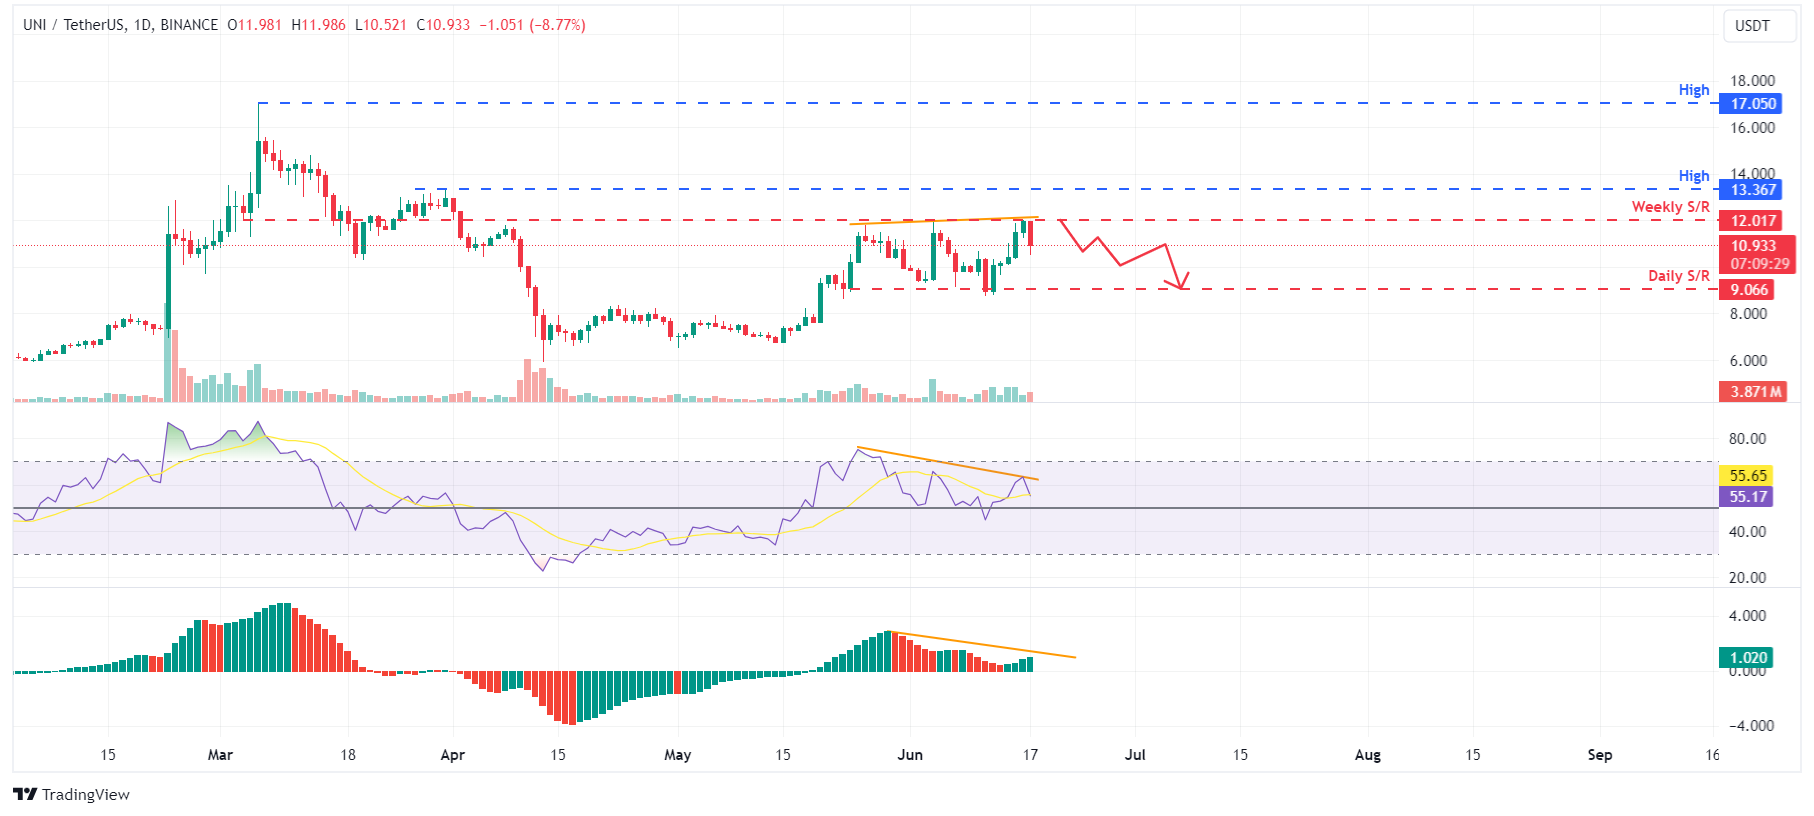
UNI/USDT 1-day chart
Santiment's data on Supply on Exchange illustrates the total amount of UNI tokens held across centralized exchanges (CEX), decentralized exchanges (DEX), and outside exchanges. An increase in this index suggests potential sell-offs or the formation of local price tops, while a decrease indicates whale accumulation or local price bottoms.
In UNI’s case, the Supply on Exchange increased from 67.66 million on June 15 to 68.89 million on June 17. This 2% increase in supply suggests that investors are sending their holdings into the exchanges to book profits.
%20[16.12.19,%2017%20Jun,%202024]-638542257192728722.png)
UNI Supply on Exchange chart
Santiment’s Development Activity metric tracks the frequency of project development events recorded in the public GitHub repository over time. A rise in this metric usually suggests continuous endeavors to uphold, innovate, and improve the protocol, which is generally seen as favorable by investors and stakeholders. Conversely, a decline in this metric might raise apprehensions about the project's endurance, capacity for innovation, and engagement with the community in the foreseeable future.
As in UNI’s case, the index fell from 95.14 on June 15 to 90.34 on June 17. The 5% decline in UNI’s Developing Activity adds further credence to the bearish outlook.
%20[16.12.07,%2017%20Jun,%202024]-638542257561599654.png)
UNI Development Activity chart
Even though on-chain metrics and technical analysis point to a bearish outlook, if Uniswap price produces a daily candlestick close above $13.36, the daily high from March 31, the move would invalidate the bearish thesis by making a higher high on the daily time frame. This development could see UNI's price rally 27% to the March 6 high of $17.05.
Author

Manish Chhetri
FXStreet
Manish Chhetri is a crypto specialist with over four years of experience in the cryptocurrency industry.


