Uniswap price likely to provide buy-the-dip opportunity before rallying 45%
- Uniswap price is likely to slide double-digits before it stabilizes.
- A bounce from the $9.26 to $8.29 accumulation zone could send UNI to $11.39 and $12.87.
- A breakdown of the $8.29 support level will invalidate the bullish thesis.

Uniswap (UNI) price is attempting a comeback after suffering from a 66% crash between early March and mid-April. The incoming correction will provide patient buyers an opportunity to accumulate UNI before triggering a volatile upswing.
Uniswap price sets the stage
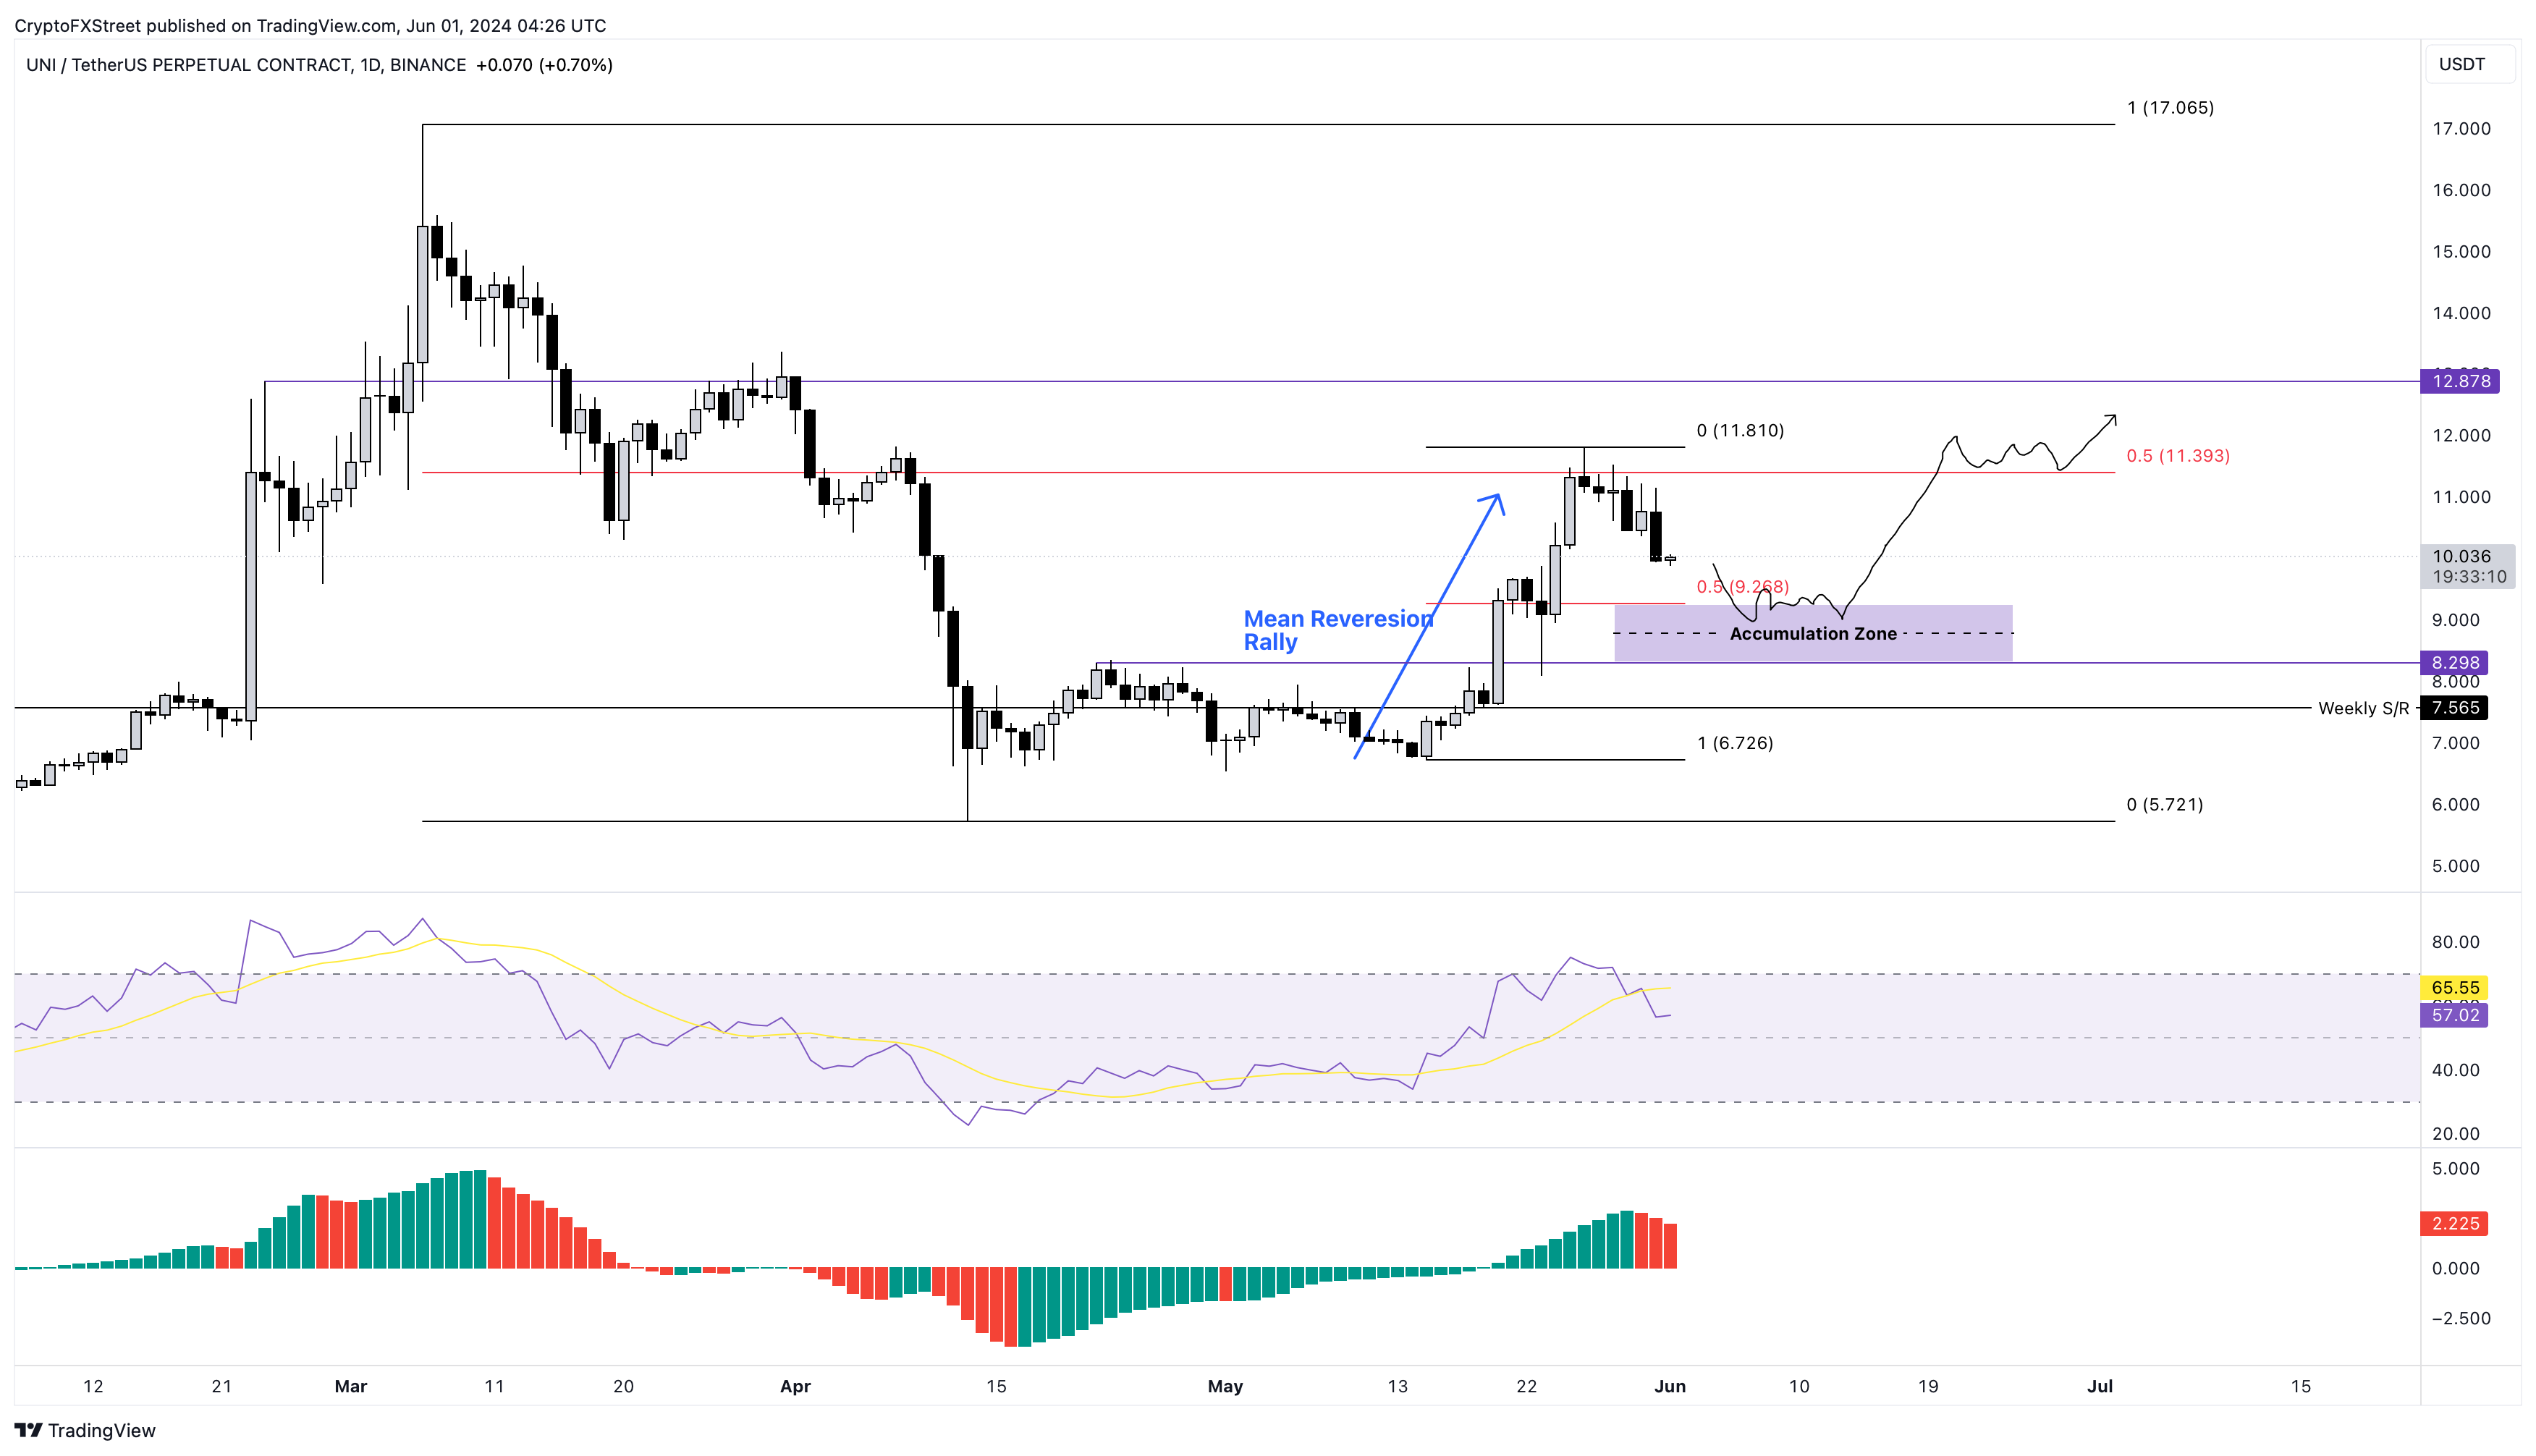
Uniswap price triggered a mean reversion rally between May 15 and May 26, pushing UNI up by 75% to set up a local top at $11.81, roughly coinciding with the midpoint of the 66% crash noted between March 6 and April 13. An interesting observation is that the 75% rally was preceded by a month-long accumulation phase. The ongoing correction is likely going to lead the DEX token into a similar sideways movement between the $9.26 to $8.29 range.
As Uniswap price bounces from the aforementioned range, investors can expect it to take another jab at the $11.39 hurdle. A flip of this key level into a support floor will be a key development, suggesting that the bulls are in control. In such a case, UNI could surge nearly 13% and revisit the $12.97. In total, this move would constitute a 45% gain from the midpoint of the aforementioned accumulation range.
The Relative Strength Index (RSI) is close to retesting the mean level of 50 on the daily timeframe, supporting this accumulation outlook for Uniswap's price and signaling a potential bounce in the works for UNI. The Awesome Oscillator (AO) is also above its mean level of zero, hinting that bullish momentum is in control.
UNI/USDT 1-day chart
Supporting this uptrend is Santiment’s 30-day Market Value to Realized Value (MVRV) indicator. The 3.88% value shows that investors who purchased UNI in the past month are at an average profit of 3.88%. Even if these holders decide to sell, it would negatively impact Uniswap price’s bullish outlook. On the contrary, investors tend to accumulate when the MVRV indicator is under the zero line.
 [09.50.39, 01 Jun, 2024]-638528127545549865.png)
UNI 30-day MVRV
On the other hand, if Uniswap price flips the $8.29 support level into a resistance level on a daily time frame, it would invalidate the bullish thesis and potentially restart the accumulation phase.
In some cases, Uniswap price could revisit the $7.56 weekly support level roughly 8% away from $8.29.
Also read: Top trending meme coins BOME, TRUMP, WIF: Bullish signs persist
Author

Akash Girimath
FXStreet
Akash Girimath is a Mechanical Engineer interested in the chaos of the financial markets. Trying to make sense of this convoluted yet fascinating space, he switched his engineering job to become a crypto reporter and analyst.


