TRON Technical Analysis: TRX must defend crucial support for the ultimate rally to $0.03
- TRON price points towards $0.03 as long as the bulls guard the immediate support at $0.0245.
- The bullish outlook to $0.03 will be validated if TRX closes above the 100 SMA in the 1-hour timeframe.

TRON has from the beginning of November recovered considerably. The bulls' return occurred in tandem with Bitcoin's surge to new yearly highs and Ethereum's rise to $470. TRX hit levels above $0.026 but stalled within a whisker of $0.027.
A little retreat came into the picture with TRX/USD refreshing the support at $0.0245. At the time of writing, TRX is trading at $0.0251 amid a developing bullish momentum. For now, attention and effort are channeled towards defending the immediate support at $0.0245.
TRON embarks on another recovery mission
The 4-hour chart shows TRON settling above the 50 Simple Moving Average, highlighted by the above mentioned vital support. Buyers seem to have regained control over the price but still lack enough power to catapult TRX to levels beyond $0.03.
On the other hand, the Relative Strength Index crossed the midline, doubling down on the improving technical picture. Buy orders are likely to surge if the RSI continues with the spike to the oversold.
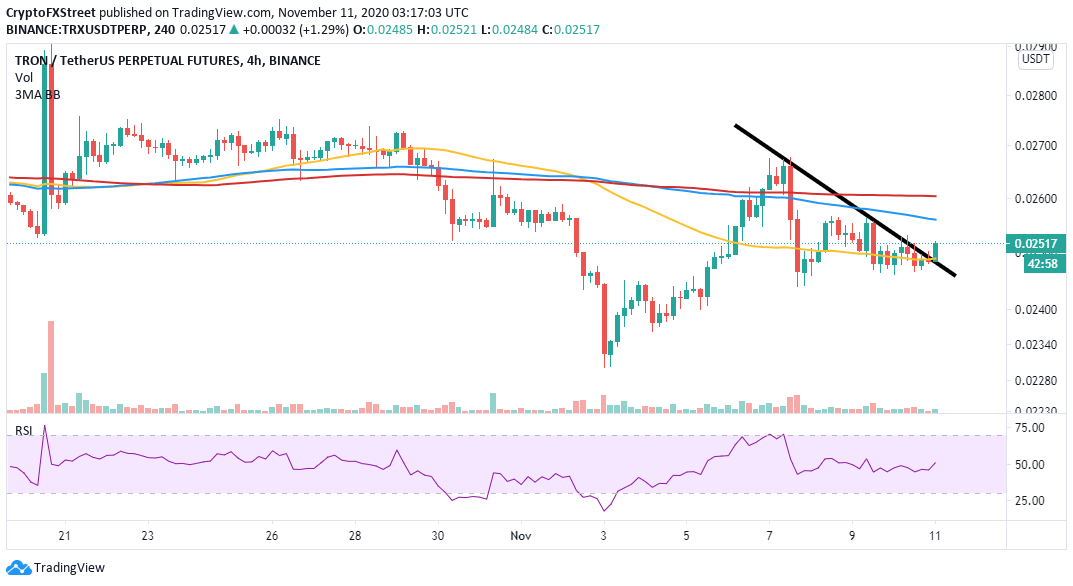
TRX/USD 4-hour chart
TRX bulls need to defend the support at the 50 SMA because the stability will allow them to focus on breaking above the hurdles at the 100 SMA, 200 SMA and $0.027. TRON is already trading above a short-term descending trendline, which adds credibility to the bullish narrative.
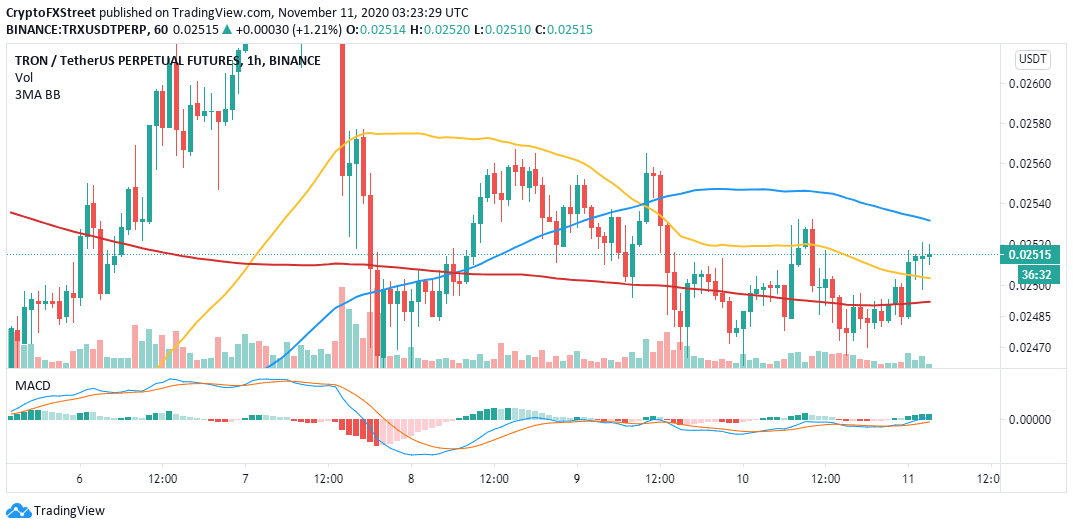
TRX/USD 1-hour chart
Similarly, the hourly chart paints another bullish picture of the smart contract token. The Moving Average Convergence Divergence (MACD) recently crossed into the positive area, pointing towards a continued bullish action. TRON's downside is also supplied with multiple anchor levels, including the 50 SMA and the 200 SMA. On the upside, closing above the 100 SMA could give TRX a massive push upwards.
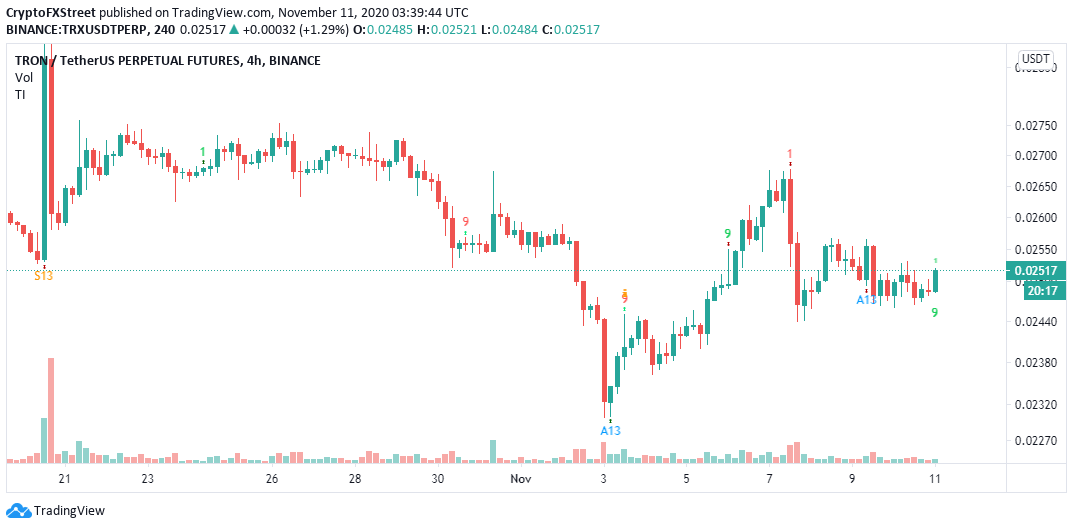
TRX/USD 4-hour chart
It is worth mentioning that the TD Sequential indicator has flashed a sell signal on the 4-hour chart. The green nine candlestick could result in one to four daily candles, hinting at a possible breakdown. If the immediate support at $0.0245 caves, TRON will most likely dive to November lows at $0.023.
Author

John Isige
FXStreet
John Isige is a seasoned cryptocurrency journalist and markets analyst committed to delivering high-quality, actionable insights tailored to traders, investors, and crypto enthusiasts. He enjoys deep dives into emerging Web3 tren


