• Tron has been trending in a narrow channel between $0.027 and $0.025.
  • The buyers are attempting a comeback in the hourly chart.

Tron reached a high of $0.40 on September 3, TRX dropped to $0.025 over the next 18 days. Following that, the price trending in a narrow channel between $0.027 and $0.025, facing multiple rejections at the 50-day SMA. 

Growth stunted by rejections

On November 5, the 100-day SMA crossed above the 50-day SMA, forming a bearish cross pattern. The MACD has also been trending in the red since October 30. These indicators tell us that further bearish price action is expected. If that does happen, it could be pretty catastrophic for the buyers as the only viable support wall on the downside lies at the 200-day SMA ($0.021).
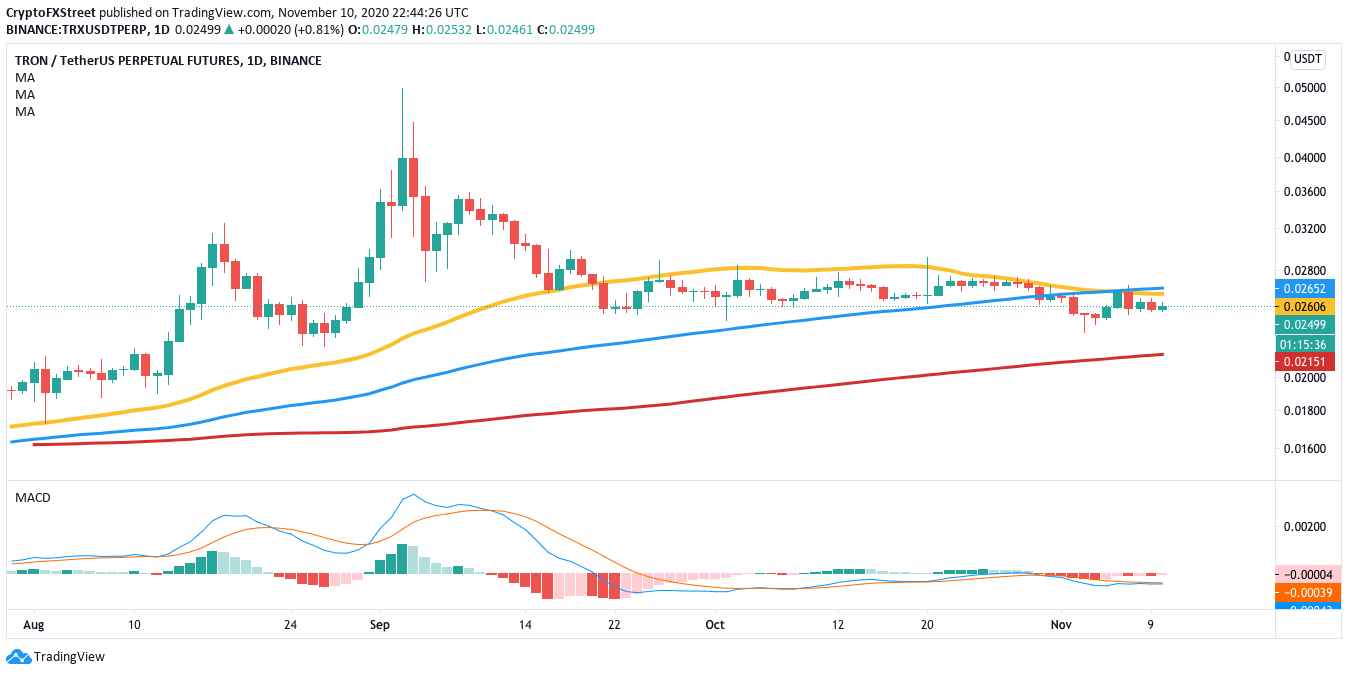
trxusd daily chart

TRX/USD daily chart

Upon shortening our timeframe, we can see that the buyers attempt to stage a comeback of sorts. The latest candlestick has managed to cross above the 200-bar SMA ($0.025) and is now aiming for the 50-bar SMA ($0.02506). If it manages to do so, the bulls will then have the license to conquer the 100-bar SMA ($0.0254). The MACD in this time frame has moved from bearish to bullish. 

trxusd hourly chart

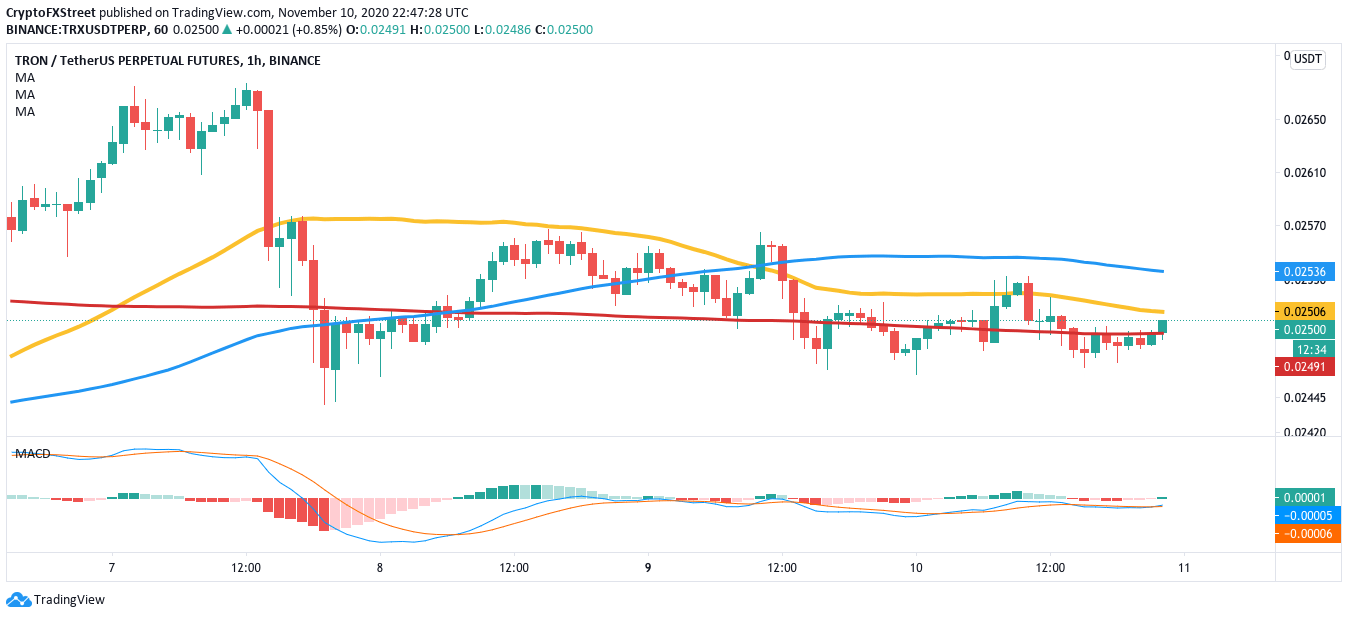
TRX/USD hourly chart

So, while the buyers aim to make some gains in the hourly chart, the overall outlook remains bearish for the "Ethereum killer." The 50-day SMA ($0.026) and 100-day SMA ($0.0265) remain two key levels that seem unsurpassable. These two barriers are strong enough to absorb a tremendous amount of buying pressure.


Note: All information on this page is subject to change. The use of this website constitutes acceptance of our user agreement. Please read our privacy policy and legal disclaimer. Opinions expressed at FXstreet.com are those of the individual authors and do not necessarily represent the opinion of FXstreet.com or its management. Risk Disclosure: Trading foreign exchange on margin carries a high level of risk, and may not be suitable for all investors. The high degree of leverage can work against you as well as for you. Before deciding to invest in foreign exchange you should carefully consider your investment objectives, level of experience, and risk appetite. The possibility exists that you could sustain a loss of some or all of your initial investment and therefore you should not invest money that you cannot afford to lose. You should be aware of all the risks associated with foreign exchange trading, and seek advice from an independent financial advisor if you have any doubts.

Join Telegram

Recommended content


Recommended Content

Editors’ Picks

Could Worldcoin price shoot up 45% ahead of OpenAI’s live stream on Monday?

Could Worldcoin price shoot up 45% ahead of OpenAI’s live stream on Monday?

Worldcoin has formed a double bottom around a key support level, suggesting a potential accumulation. If the OpenAI’s Monday live stream has a positive impact on Artificial Intelligence field, it could positively impact WLD and other AI-based tokens. 

More Worldcoin News

Here’s what needs to happen for The Graph price to revisit $0.422

Here’s what needs to happen for The Graph price to revisit $0.422

The Graph price trades inside the $0.192 to $0.494 range. Investors need to wait for GRT to overcome $0.343 before being bullish on GRT. If successful, GRT could rally 50% and revisit the $0.422 hurdle. A decisive daily candlestick close below $0.192 will invalidate the bullish thesis.

More The Graph News

SingularityNET price could bounce 30% if AGIX can hold this level

SingularityNET price could bounce 30% if AGIX can hold this level

SingularityNET price has been consolidating around the bottom of the $0.903 to $1.475 range for nearly a month. With some AI-tokens showing signs of revival, AGIX needs to be enalyzed for potential breakout opportunities like Arkham (ARKM).

More SingularityNET News

Arkham price primed for a recovery rally ahead of OpenAI’s announcement

Arkham price primed for a recovery rally ahead of OpenAI’s announcement

Arkham price eyes a potential reversal as it clears key hurdles. ARKM likely to rally 27% if it can overcome $2.74 resistance level. A breakdown of $2.28 wil invalidate the bullish thesis for the AI-based token.

More Arkham News

Bitcoin: Why BTC is close to a bottom

Bitcoin: Why BTC is close to a bottom

Bitcoin (BTC) price efforts of a recovery this week have been countered by selling pressure during the onset of the American session. However, the downside potential appears to have been capped. Markets have noted significant trading differences between sessions, and while the Asian market showed strength, whatever ground they were able to cover was oftentimes wiped out by traders in the US.

Read full analysis

BTC

ETH

XRP