|

TRON price boldly overcomes trend line resistance

  • TRON price only 5% away from the 2018 all-time high at $0.100.
  • Volume running more than double the daily average.
  • Delicate decision facing traders today.

TRON price putting pressure on the bulls to decide between capturing a 50% gain today or waiting to see if it has the momentum to test the all-time high. Simply, risk a reversal for an extra 5%?

TRON price in the blow-off phase

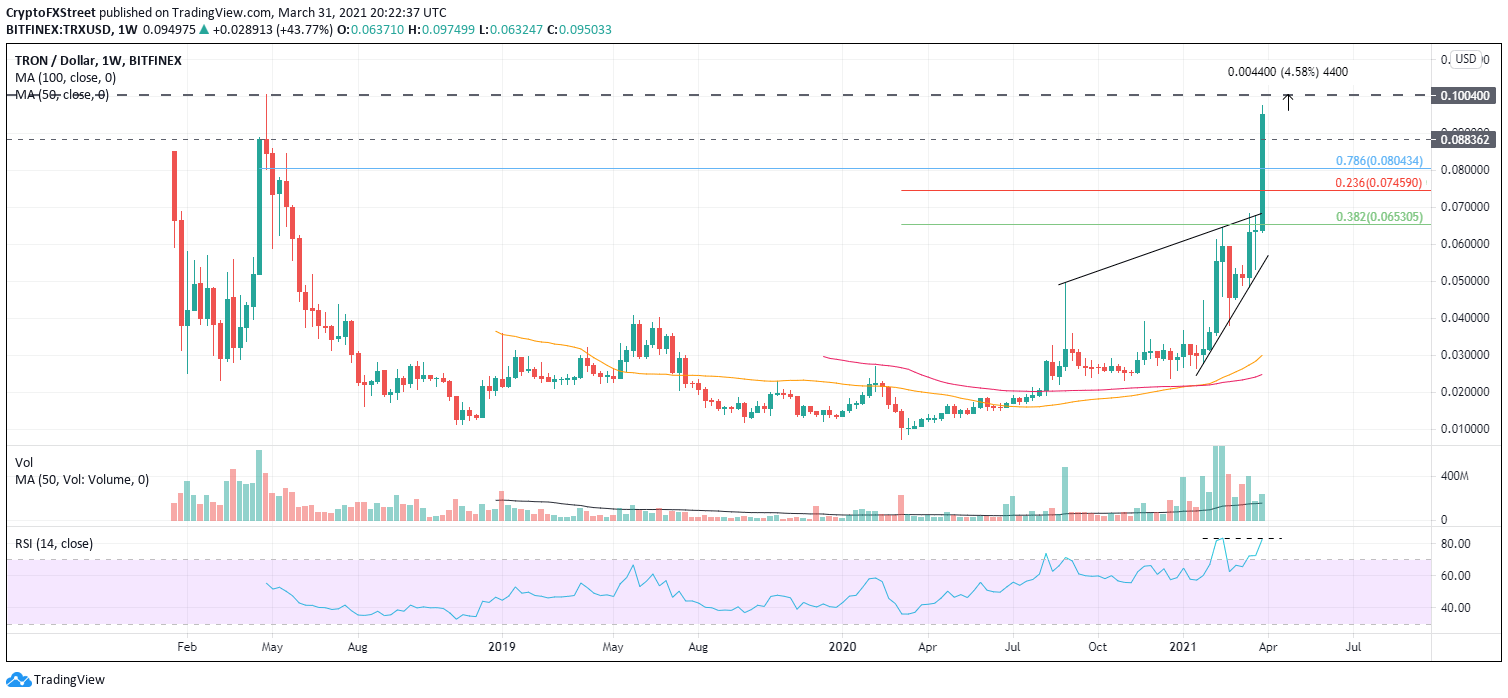
For consecutive weeks this month, TRX failed to overcome the topside trend line’s resistance from August 2020 through the February high at $0.067. This week is a different story as the digital token has quickly cleared the displayed trend line and rallied through the 0.786 Fibonacci retracement of the 2018-2020 bear market at $0.080 and the highest weekly close in 2018 at $0.088. 

At the time of writing, TRX is not showing signs of exhaustion, and it MAY hit the all-time high today or this week. However, it is essential to underscore that this is the blow-off move for the 2021 rally, and traders should be preparing to lock in gains.

The only clear upside target is the all-time high at $0.100.
TRX/USD weekly chart

TRX/USD weekly chart

As with all trading opportunities, downside protection is critical, and traders should plot the highest weekly close of 2018 at $0.088 to start. If that fails to hold, TRX will crumble to the 0.236 Fibonacci retracement of the 2021 rally at $0.074. The topside trendline is the next support level, currently at $0.068, followed by the 0.382 retracement level at $0.065.

Author

Sheldon McIntyre, CMT

Sheldon McIntyre, CMT

Independent Analyst

Sheldon has 24 years of investment experience holding various positions in companies based in the United States and Chile. His core competencies include BRIC and G-10 equity markets, swing and position trading and technical analysis.


More from Sheldon McIntyre, CMT
Share:

Editor's Picks

Ripple and Stellar outlook: XRP and XLM await direction amid cautious sentiment

Ripple and Stellar trade cautiously as both tokens hover around key technical levels. XRP is testing resistance at its 50-day EMA, while XLM continues to consolidate around the $0.187 support zone. Meanwhile, mixed derivatives data with a slight bearish tilt suggests traders remain cautious, keeping the next directional move uncertain.

Crypto Market Overview: Bitcoin recovery eases – HBAR and LDO test key resistance zones

Bitcoin edges below $66,000 extending the previous day's losses. Hedera and Lido DAO sustain bullish momentum, testing the breakout of a crucial resistance zone to extend their rally. CoinMarketCap’s Fear and Greed Index at 39 stalls below the neutral territory, indicating that sellers remain dominant.

Senate Republicans release updated CLARITY Act with new crypto ethics restrictions

Senate Republicans released an updated version of the Digital Asset Market CLARITY Act on Wednesday following briefing calls with stakeholders. The update adds a package of ethics restrictions targeting digital asset activities by public officials and their spouses.

Hyperliquid, Robinhood could lead crypto’s next bull market as DeFi and TradFi converge
The next crypto bull market could be driven by the growing convergence between blockchain-based financial infrastructure (on-chain) and traditional finance (TradFi), according to Bitwise CIO Matt Hougan. In a report published late Tuesday, Hougan argued that crypto may be showing early signs of a market bottom, with Bitcoin gaining 9% since July 1 even as the NASDAQ 100 declined 6%.
Bitcoin’s potential recovery in the second half hinges on these 4 catalysts
Bitcoin (BTC) has fallen over 34% in the first half of this year as the King Crypto failed to capitalize on a good semester for risk assets despite the woes from the Iran war.

