Top trending meme coins PEPE, BOME, TRUMP experience a double-digit crash
- Pepe price retests daily support at $0.0000060; a close below could lead to further decline.
- Book of Meme close below the ascending trendline, signaling a shift in market structure from bullish to bearish.
- TRUMP's price closes below the weekly support, suggesting a bearish move ahead.

Pepe (PEPE), Book of Meme (BOME), and Trump (MAGA) are testing crucial support levels following a double-digit crash on Monday, with the technical outlook suggesting potential corrections for all three.
PEPE price set for crash after closing below daily support level
Pepe’s price closed below the ascending trendline (drawn by joining multiple swing lows from mid-April) on Saturday, leading to a 6% decline over Sunday. On Monday, it crashes down 19% to trade at $0.0000065 at the time of writing, having tested the daily support level at $0.0000060 earlier in the day.
If PEPE continues to decline and close below the daily support level at $0.0000060, it could crash 20% to retest its next daily support at $0.0000048.
The Relative Strength Index (RSI) and the Awesome Oscillator on the daily chart have dropped below their neutral levels of 50 and zero, respectively, signaling a bearish trend according to these momentum indicators.
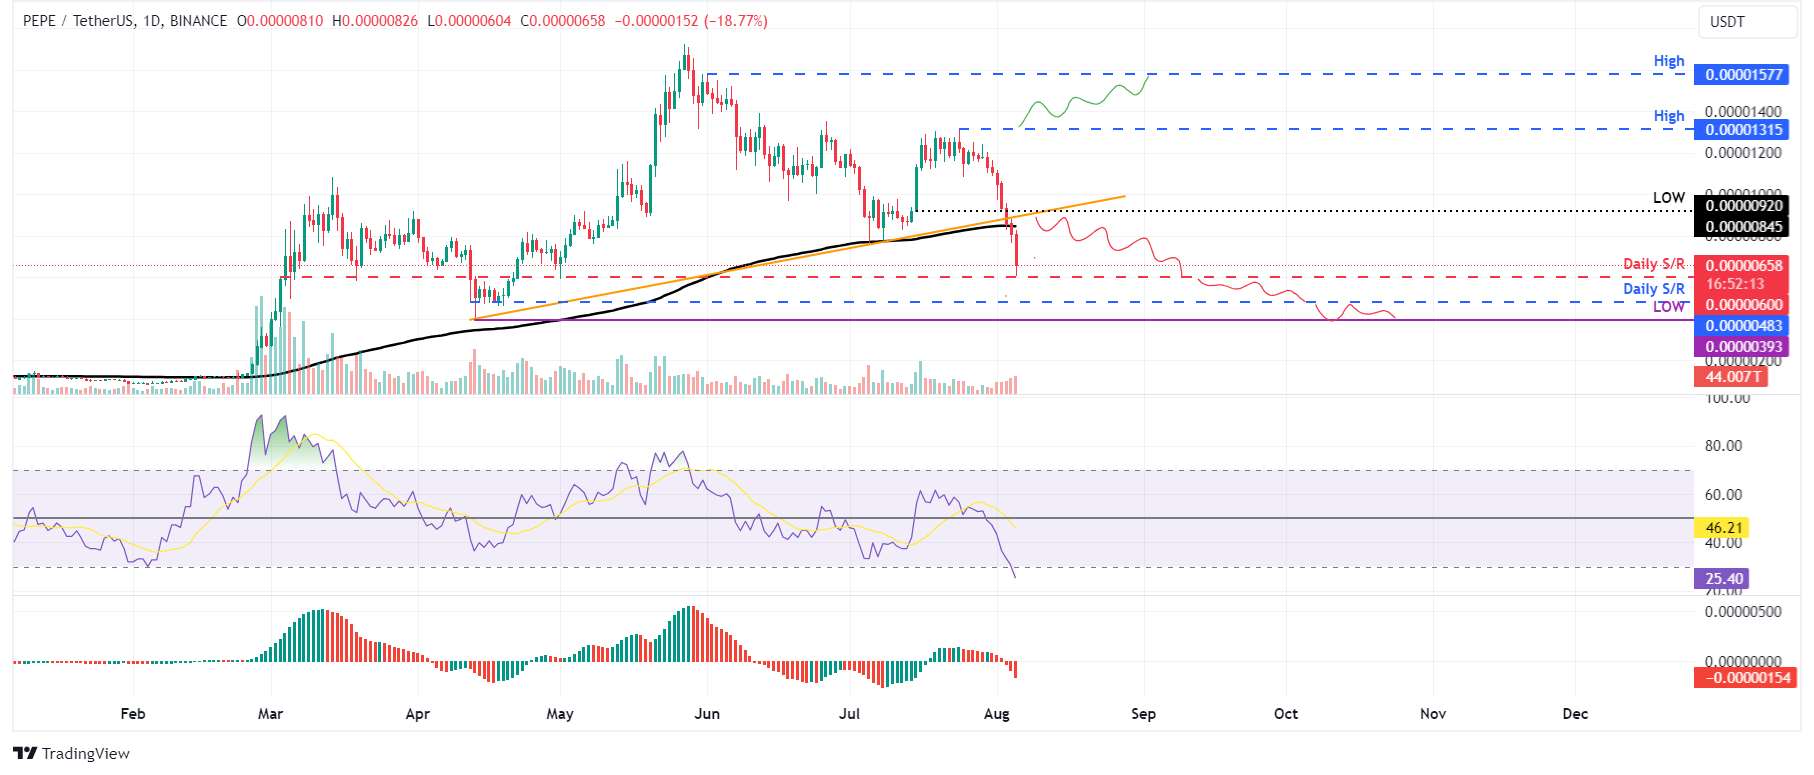
PEPE/USDT daily chart
On the other hand, if Pepe closes above $0.000013, it would change the market structure by forming a higher high on the daily timeframe. Such a scenario might drive a 15% rally in Pepe's price to retest its June 1 high of $0.000015.
BOME price poised for a crash following a close below $0.0063
BOOK OF MEME’s price closed below the ascending trendline (drawn by joining multiple swing lows from July 5) on Saturday, leading to a 5.7% decline over Sunday. On Monday, it crashed down 17.4% to trade at $0.0060 at the time of writing, having traded below the July 5 low of $0.0063.
If BOME closes below the $0.0063 level, it could crash 33% to retest the 141.4% Fibonacci extension at $0.0042.
The Relative Strength Index (RSI) and the Awesome Oscillator on the daily chart have dropped below their neutral levels of 50 and zero, respectively, signaling a bearish trend according to these momentum indicators.
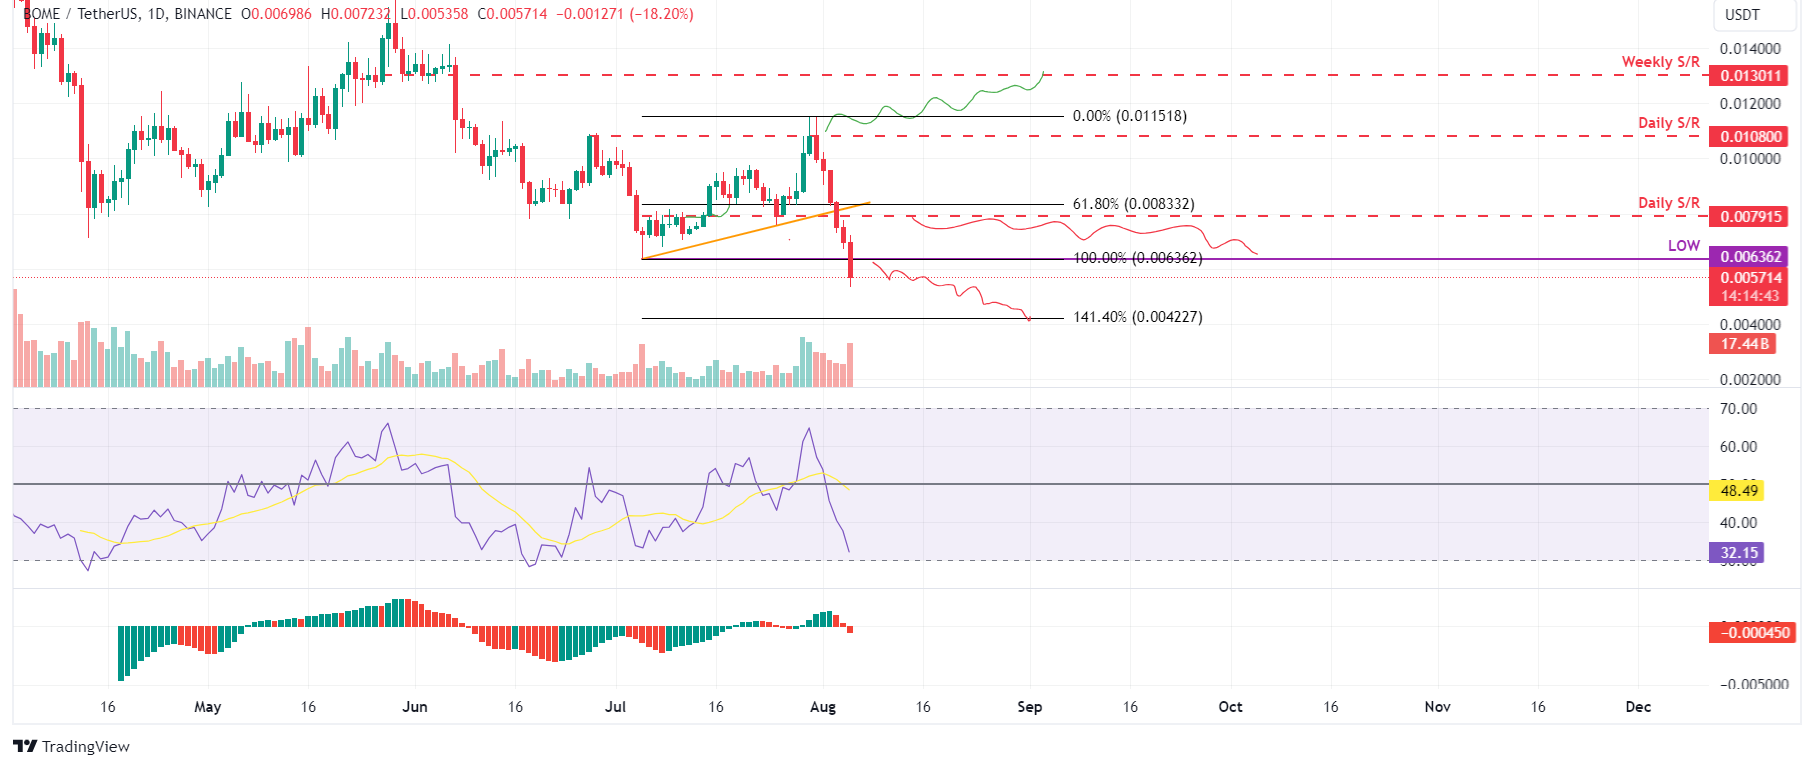
BOME/USDT daily chart
On the other hand, if BOME closes above $0.0108, it would change the market structure by forming a higher high on the daily timeframe. Such a scenario might drive a 20% rally in BOOK OF MEME price to retest its weekly resistance at $0.0130.
TRUMP price sets for a decline following a close below the $2.68 mark
TRUMP’s price closed below the weekly support level at $4.57 on Friday and declined 8.6% over the next two days. As of Monday, it crashes down 23% to trade at $3.18 at the time of writing, having tested the daily support level at $2.68.
If TRUMP closes below the daily support at $2.68, it could continue to crash 30% and retest its weekly support at around $1.87.
The Relative Strength Index (RSI) and the Awesome Oscillator on the daily chart have dropped below their neutral levels of 50 and zero, respectively, signaling a bearish trend according to these momentum indicators.
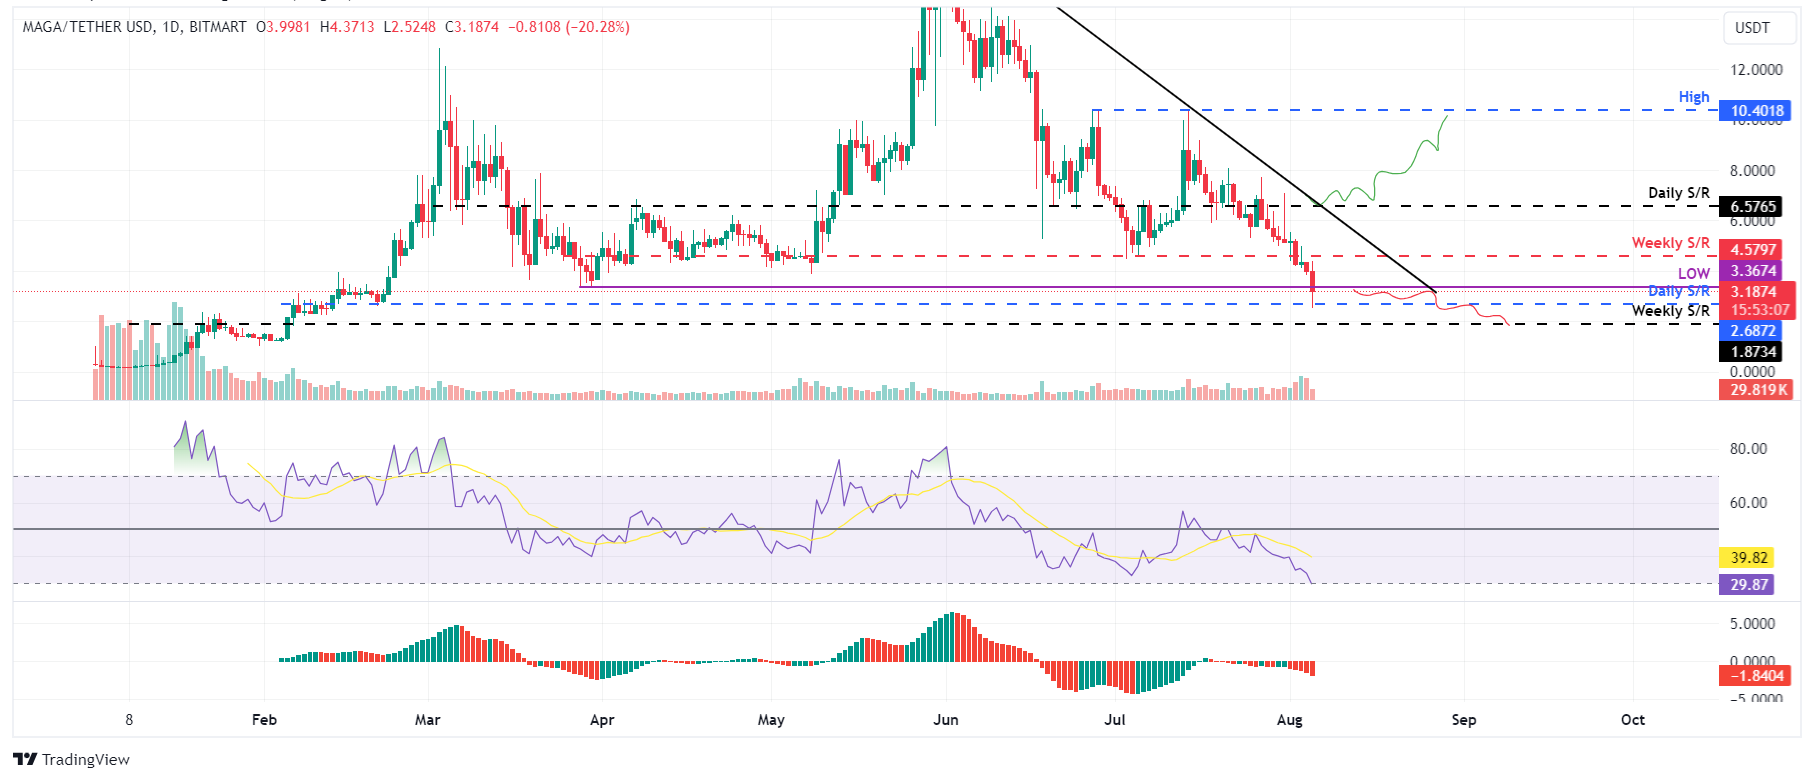
TRUMP/USDT daily chart
On the other hand, if TRUMP closes above $6.57, it would change the market structure by forming a higher high on the daily timeframe. Such a scenario might drive a 58% rally in TRUMP price to retest its June 27 high of $10.40.
Author

Manish Chhetri
FXStreet
Manish Chhetri is a crypto specialist with over four years of experience in the cryptocurrency industry.


