PEPE price poised for correction as whale takes profits
- Pepe price breaks below the daily support level of $0.0000105, signaling a break in market structure from bullish to bearish.
- Lookonchain data shows a whale deposited 400 billion PEPE tokens worth $4.22 million on the Binance exchange.
- The Network Realized Profit/Loss metric shows upward spikes, indicating that, on average, holders are selling their assets and increasing selling pressure.
- A daily candlestick close above $0.0000131 would invalidate the bearish thesis.

Pepe (PEPE) fell below a daily support level on Thursday and declined by 2.5% on Friday. On-chain data shows that holders are selling their assets and intensifying selling pressure, which could lower the frog-themed meme coin price in the coming days.
Additionally, Lookonchain data reveals that a whale deposited 400 billion PEPE tokens, worth $4.22 million, onto the Binance exchange on Thursday, further reinforcing the bearish outlook.
A whale deposited 400B $PEPE($4.22M) to #Binance to take profits in the past hour.
— Lookonchain (@lookonchain) August 1, 2024
The whale withdrew 795.92B $PEPE($2.55M at the time) from #Binance on Mar 1 and currently has 395.93B $PEPE($4.18M) left.
His total profit on $PEPE is $5.85M, the ROI is 230%!… pic.twitter.com/o7T1ihjoq9
PEPE price risks 10% drop after breaking below key support level
Pepe broke below the daily support level at $0.0000105 on Thursday. As of Friday, it continues to decline by 2.5% and trades at $0.0000102.
If the former daily support level at $0.0000105 acts as resistance, PEPE could crash 10% and retest its July 15 daily low of $0.0000092.
The Relative Strength Index (RSI) on the daily chart has dropped below its neutral level of 50, and the Awesome Oscillator (AO) is nearing a fall below its neutral zero level. If both indicators stay in these bearish zones, PEPE's price could experience further declines.
If PEPE closes below the ascending trendline established in mid-April, it could decline by an additional 18% and revisit its July 5 low of $0.0000076.
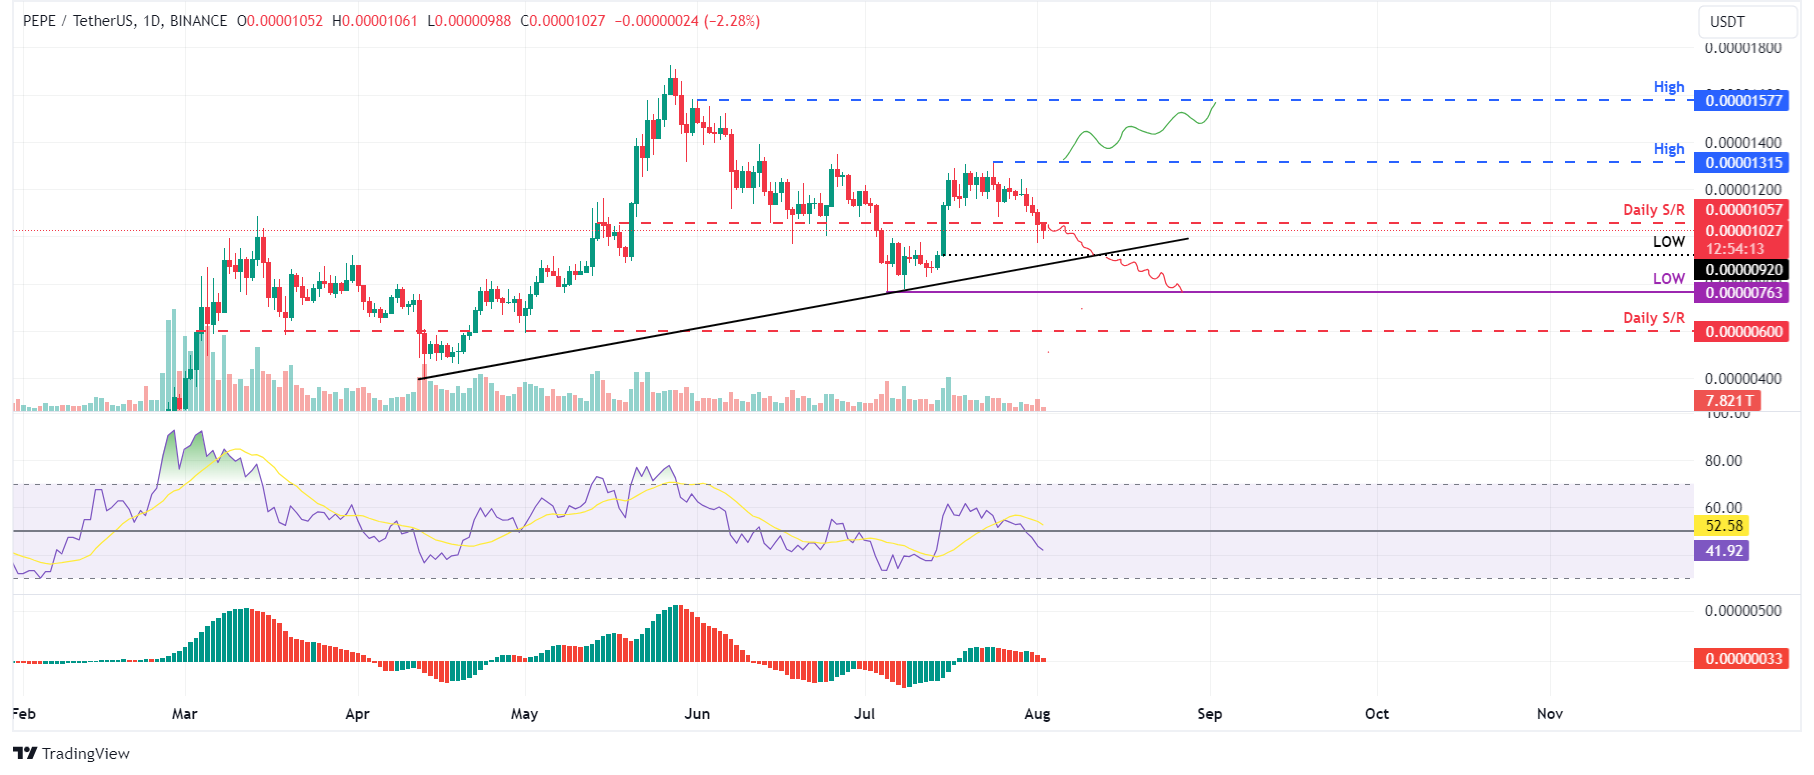
PEPE/USDT daily chart
On-chain data provider Santiment's Network Realized Profit/Loss (NPL) indicator computes a daily network-level Return On Investment (ROI) based on the coin's on-chain transaction volume. Simply put, it is used to measure market pain. Strong spikes in a coin's NPL indicate that its holders are, on average, selling their bags at a significant profit. On the other hand, strong dips imply that the coin's holders are, on average, realizing losses, suggesting panic sell-offs and investor capitulation.
In PEPE's case, the NPL indicator jumped from -23,432 to 6.59 million on Thursday. These upticks have been seen since mid-July, which indicates that the holders are, on average, selling their bags at a significant profit and increasing selling pressure.
On the other hand, during this event, the PEPE's supply on exchanges, which has continued to increase since July 4, rose by 1%. This development indicates that investors are selling their PEPE tokens on exchanges, which increases selling activity and adds credence to the bearish thesis.
%20[16.18.59,%2002%20Aug,%202024]-638582012767656270.png)
PEPE Network Realized Profit/Loss and Supply on Exchanges chart
Even though the on-chain metric and technical analysis point to a bearish outlook, if Pepe's daily candlestick closes above $0.0000131, the bearish thesis would be invalidated by producing a higher high on the daily timeframe. In this case, the Pepe price would rally 20% to the June 1 high of $0.0000157.
Author

Manish Chhetri
FXStreet
Manish Chhetri is a crypto specialist with over four years of experience in the cryptocurrency industry.


