Top3 Layer 1 tokens SOL, LTC, BNB: Scouting coins with crypto season potential
- Solana is down 70% on the month and could breach the $10 zone in the coming days.
- Litecoin price has diverged from the market by producing a 75% rally in November.
- Binance Coin price could fall toward $285 before sidelined bulls get involved.

As the crypto market hovers near new monthly lows, taking time to assess cryptocurrencies is vital. Layer 1 tokens Solana, Litecoin, and Binance all show potential for more gains, but traders should be aware of the bearish influence and their target zones.
Solana price could tag $10 then pump
Solana price has witnessed a devastating decline during the month. As the Sam Bankman-Fried and FTX scandal unveils more information, SOL's name has become entangled in the controversy. According to sources, FTX held more than $982 million worth of SOL before filing for bankruptcy.
Investors are honed into the situation, likely contributing to SOL's free decline. At the time of writing, Solana price currently auctions at $14.04. A massive uptick in transactions was displayed on the Volume Indicator on November 13 during the first break of the $13 barrier. The indicator has since declined as bulls have prompted several attempts to recover losses.
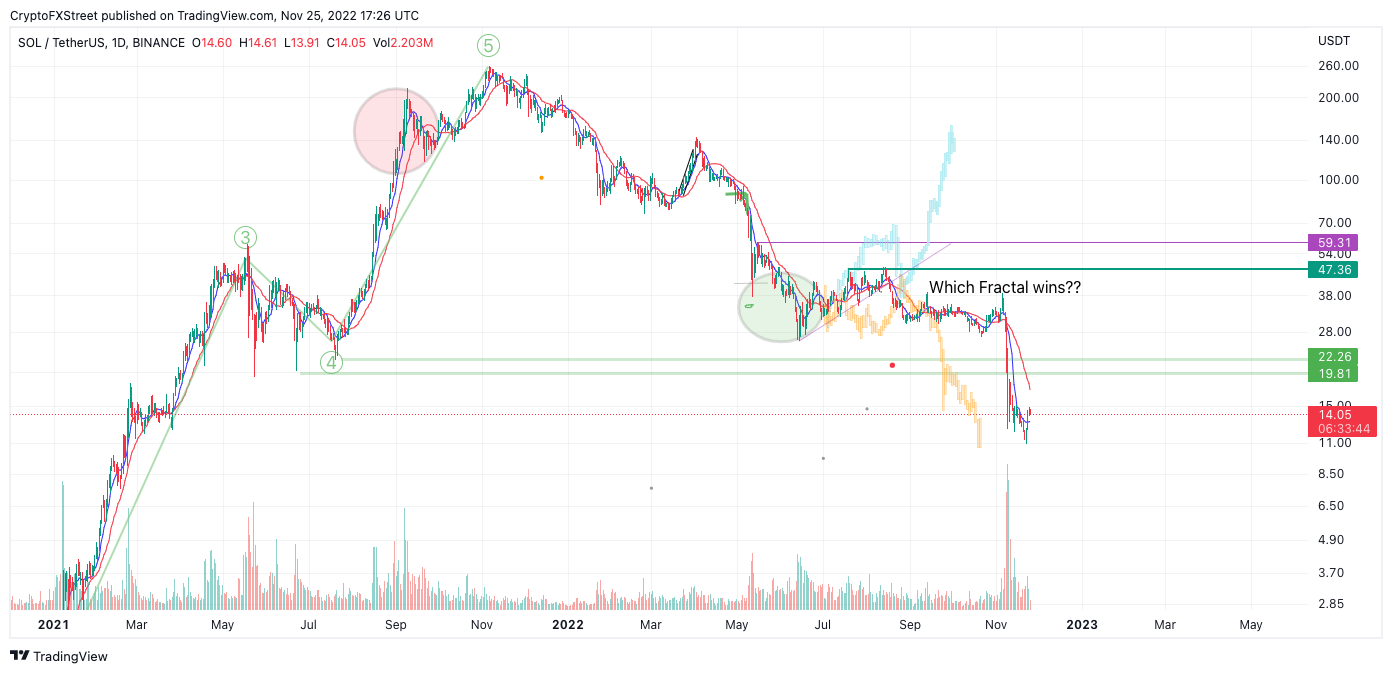
SOL/USDT 1-day chart
Solana price will need to produce a lot more vigor in the market to believe in a strong countertrend rally. A fractal wave used to project Solana into current price levels back in July shows SOL targeting the $10.50 barrier. After tagging that level, a potential to rally mid-way from the 70% decline near $22 stands a fair chance of occurring.
Thus, traders should consider waiting for one more low on the Solana price before getting involved in a knife-catching trade. The invalidation of the bearish thesis targeting $10.50 is a breach above the 21-day simple moving average at $17.50. A barrier breach would yield more confidence that SOL could rise by 60% into the $22 zone.
Litecoin price diverges from the market
Litecoin price stunned the market as the "Silver to Bitcoin's Gold" cryptocurrency rallied by 75% since November 9. As the price consolidates near the newfound monthly highs, traders question what will happen next.
Litecoin price currently auctions at $74.65. A stop candle has been produced near the top of the rally while bears are trying to forge a retreat of the 8-day exponential moving average hovering near $70. On the daily timeframe, the Relative Strength Index (RSI) shows a clear bearish divergence between new highs at $83.66 and those established on November 9 near $68. The pattern will likely entice traders to open a short position in the coming days.
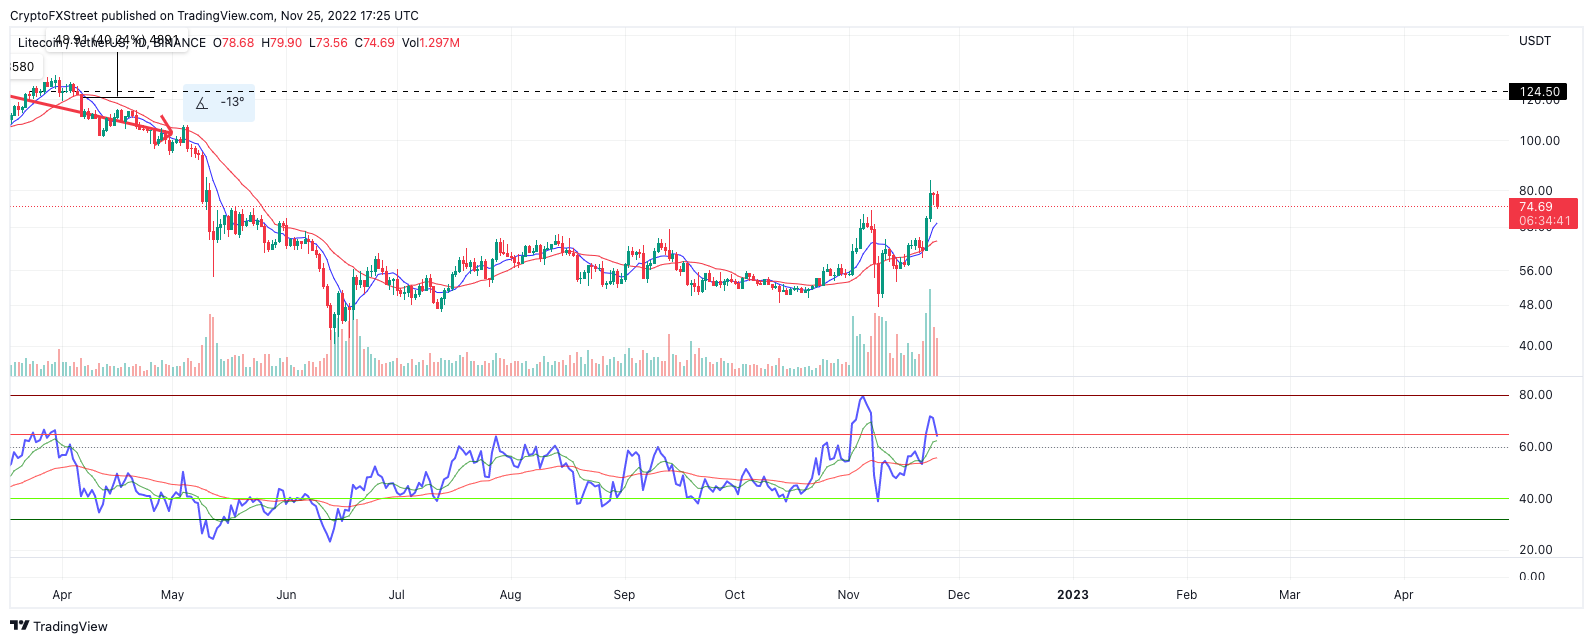
LTC/USDT 1-day chart
Still, the RSI reading is shown in overbought territory, meaning the LTC price has a fair chance of bouncing higher. The Volume indicator confounds this idea as a classical ramping pattern is displayed within the recent uptrend hike. If the market is genuinely bullish, a spike into $90 and $100 liquidity zones will be the next targets to aim for.
Invalidation of the bullish thesis is a breach below the 21-day simple moving average currently positioned at $64.40. If the bears breach the indicator, the bullish potential would be void. A decline toward the swing lows at $49.57 would become a plausible card on the table. A decline into the low would result in a 37% decrease from the current Litecoin price.
Binance Coin price has space to fill
Binance Coin price has produced a 20% countertrend spike this week. The bulls have successfully breached the 8-day exponential and 21-day simple moving averages. As the price hovers above the indicators, there are still a few factors to consider before entering the market.
Binance Coin price currently auctions at $301. During the recent uptrend hike, the Volume indicator shows fewer transactions than the previous monthly decline, which sent BNB into the $250 barrier. Additionally, there is a sharp bearish divergence between the initial countertrend rally on November 9 and the current BNB price. It is worth noting that the November 9 recovery rally also showed more bullish strength on the Volume Indicator.
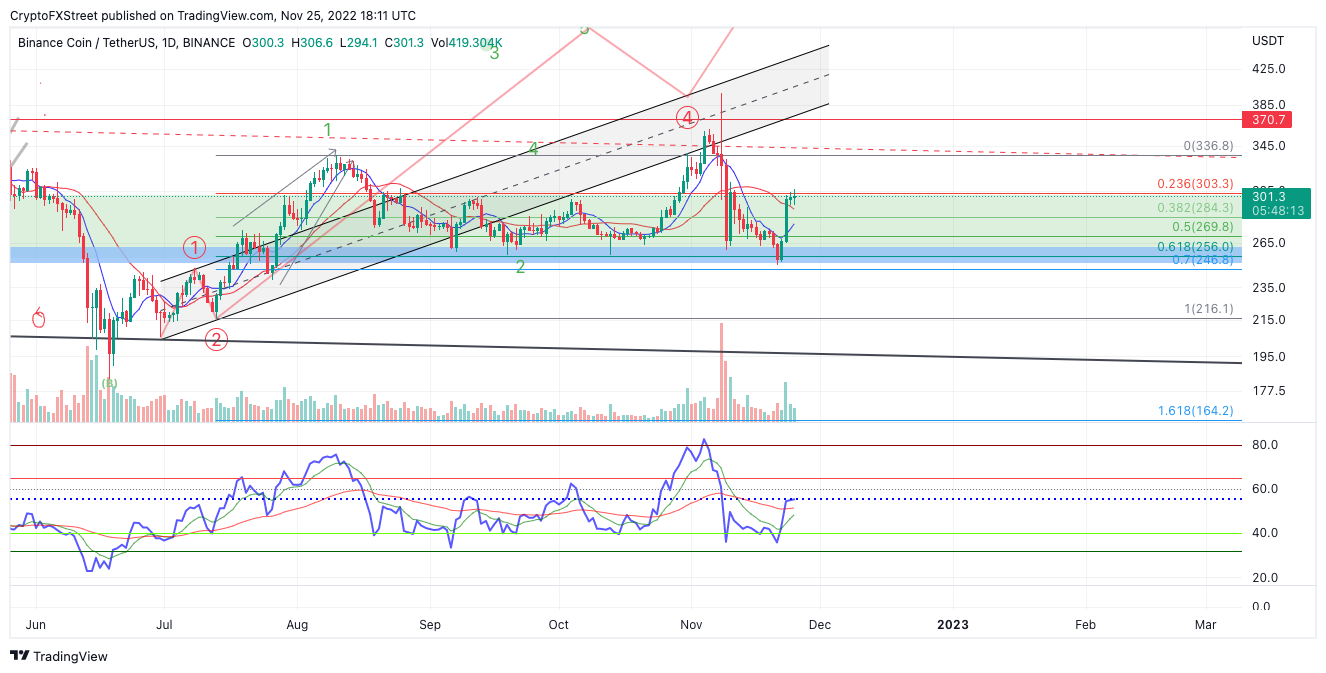
BNB/USDT 1-day chart
Considering these factors, BNB may need to stay rangebound further to mitigate the RSI imbalances. A Fibonacci retracement tool surrounding the strongest part of the summertime rally shows the current range between 61.8% and 23.6%. The BNB price has spent spare time filling the 38.2% zone near $284. BNB price could retrace into the boundary in the coming days before further bullish interest arises.
The invalidation of the bearish thesis targeting $284 is a breach above the $310 liquidity zone. If that is the case, a continuation of the uptrend targeting the monthly high near $398 will likely ensue. Such a move would result in a 33% increase from the current BNB price.
Author

Tony M.
FXStreet Contributor
Tony Montpeirous began investing in cryptocurrencies in 2017. His trading style incorporates Elliot Wave, Auction Market Theory, Fibonacci and price action as the cornerstone of his technical analysis.


