- Short-term general indetermination is seen.
- After big increases from the lows, quick sales appear.
- There is a loss of trend strength in the short term.
I begin the crypto market analysis week with the three segment leaders painting the price charts green.
As I commented in last Friday's analysis, the market is at the beginning of the process of turning the leading indicators in the daily time range. It is a process that is likely to take several weeks to develop, increasing daily uncertainty.
At the moment, today's gains remain within the bullish rebound scenario integrated into a superior bearish cross trend in the indicators. If the rises accelerate, we could consider a change of scenario towards an overbought one, a probable scenario thanks to the fact that in the weekly range the indicators are pointing upwards and without obstacles ahead.
ETH/BTC 4 Hours Chart
The ETH/BTC pair remains in the lowest band of the bullish parallel line structure that is born from the December lows. A confirmation of the movement of the lower line cannot be ruled out.
Above the current price, the first resistance level for the ETH/BTC pair is at 0.0328 (first upper parallel trendline), then the second resistance level is at 0.033 (price congestion resistance). The third resistance level for the market's leading pair is at 0.0339 (second upper parallel trend line).
Below the current price, the first support level is at 0.0316 (price congestion support), then the second support level is at 0.0310 (lower parallel trendline). The third support level for the ETH/BTC pair is at 0.0301 (price congestion support).
-636909173377054724.png)
The MACD on the 4-hour chart is crossed upward, with little inclination and the average opening between lines. The lack of inclination subtracts power from the cross, and some downward volatility cannot be ruled out.
The DMI on the 4-hour chart shows both sides of the market almost tied in the slack. Both are moving below level 20, informing us of the lack of a clear scenario in the short term.
Do you want to know more about my technical setup?
BTC/USD 4 Hour Chart
BTC/USD is currently trading at the $5,158 price level, after spending the last few days on the EMA50 and regaining support for the $5,100 price congestion today.
Above the current price, the first resistance level is at $5,500 (price congestion resistance), then the second resistance level is at $6,300 (price congestion resistance). The third resistance level for the BTC/USD pair is a confluence of two price congestion resistances of $6,400 and $6,500.
Below the current price, the first support level is at $5,100 (price congestion support and EMA50), then the second support level is at $4,885 (SMA100). The third level of support for the BTC/USD pair is at $4,600 (price congestion support and SMA200).

The MACD on the 4-hour chart is crossed higher but just below the "0" level of the indicator. Remaining below this level weakens the bullish potential very much, needing more buying power than usual to move forward.
The DMI on the 4-hour chart shows a similar tie to the ETH/BTC pair. The big difference is that in this case the bulls mark 21 and declare trend strength while the bears do not. The advantage is minimal but can be sufficient.
ETH/USD 4 Hour Chart
The ETH/USD is currently trading at the $168 price level, clinging to the EMA50 to maintain the positive momentum.
Above the current price, the first resistance level for the ETH/USD pair is at $180 (price congestion resistance), then the second resistance level is at $190 (price congestion resistance), and the third resistance level is at $200 (price congestion resistance).
Below the current price, the first support level is immediate at $166 (EMA50), then the second support level is $160 (SMA100 and price congestion support). The third level of support for the ETH/USD pair is at $150 (price congestion support and SMA200).

The MACD on the 4-hour chart shows an upward cross profile, with little inclination but good openness. The situation below the "0" line of the indicator takes away a lot of upside potential.
The DMI on the 4-hour chart also shows a virtual tie between the two sides of the market. In the case of the ETH/USD pair, the bears barely exceed the level considered as holding stock (20), while the bulls weaken and fail to make it above the same level.
XRP/USD 4 Hour Chart
The XRP/USD is currently trading at the $0.3280 price level after finding support in the SMA200 over the past few days.
Above the current price, the first resistance level for the XRP/USD pair is $0.0335 (congestion resistance, EMA50, and SMA100). Above this resistance level, the pair could move quickly to the second resistance level at $0.367 (price congestion resistance). The third resistance level is at $0.39 (price congestion resistance).
Below the current price, the first support level is $0.327 (price congestion support and SMA200), then the second support level is $0.317 (price congestion support). The third support level is $0.31 (price congestion support).
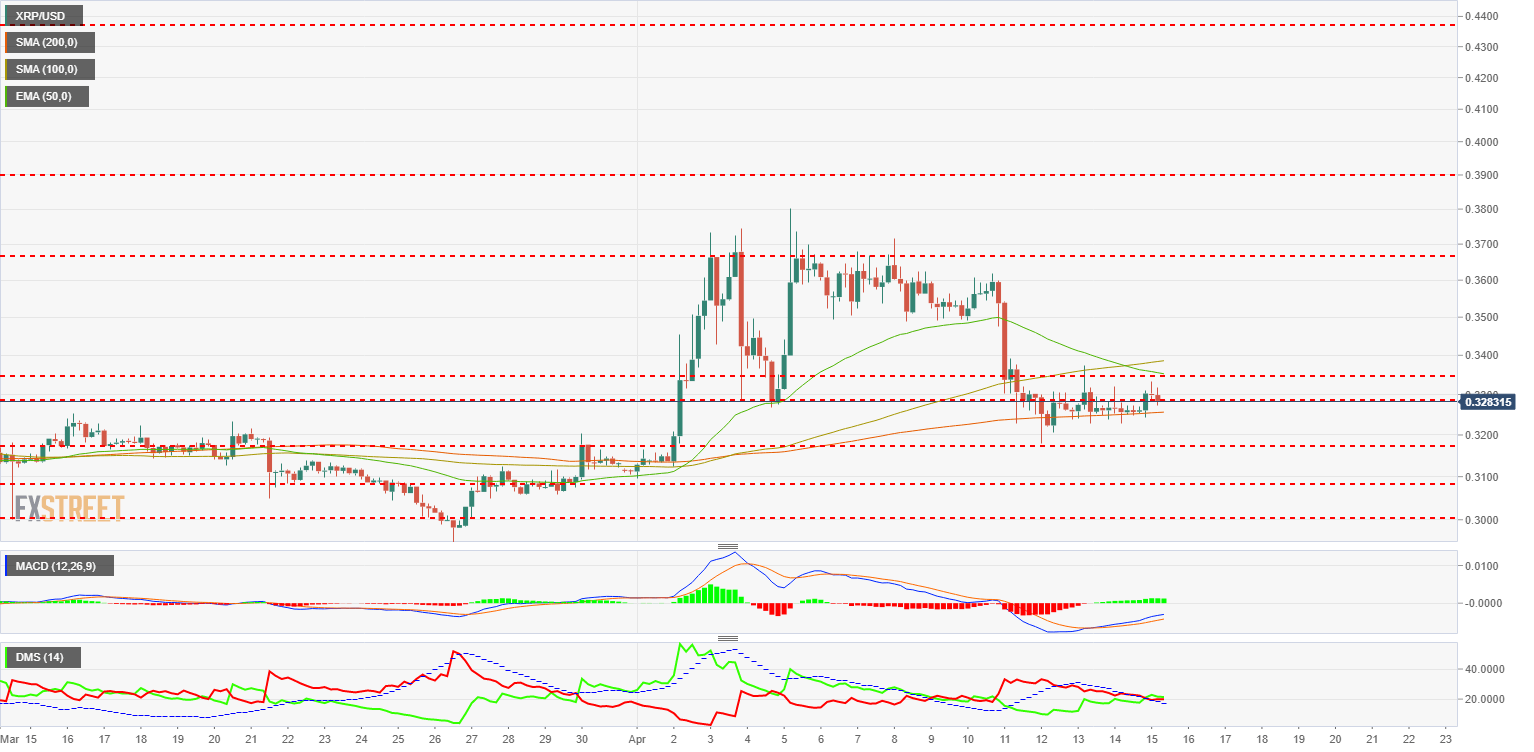
The MACD on the 4-hour chart shows a bullish cross, with good inclination but little openness between the lines. The structure is bullish but with obvious difficulties to develop.
In the case of the XRP/USD pair, the bulls have a slight advantage and move above level 20, while the bears are slightly below.
Get 24/7 Crypto updates in our social media channels: Give us a follow at @FXSCrypto and our FXStreet Crypto Trading Telegram channel
Information on these pages contains forward-looking statements that involve risks and uncertainties. Markets and instruments profiled on this page are for informational purposes only and should not in any way come across as a recommendation to buy or sell in these assets. You should do your own thorough research before making any investment decisions. FXStreet does not in any way guarantee that this information is free from mistakes, errors, or material misstatements. It also does not guarantee that this information is of a timely nature. Investing in Open Markets involves a great deal of risk, including the loss of all or a portion of your investment, as well as emotional distress. All risks, losses and costs associated with investing, including total loss of principal, are your responsibility. The views and opinions expressed in this article are those of the authors and do not necessarily reflect the official policy or position of FXStreet nor its advertisers. The author will not be held responsible for information that is found at the end of links posted on this page.
If not otherwise explicitly mentioned in the body of the article, at the time of writing, the author has no position in any stock mentioned in this article and no business relationship with any company mentioned. The author has not received compensation for writing this article, other than from FXStreet.
FXStreet and the author do not provide personalized recommendations. The author makes no representations as to the accuracy, completeness, or suitability of this information. FXStreet and the author will not be liable for any errors, omissions or any losses, injuries or damages arising from this information and its display or use. Errors and omissions excepted.
The author and FXStreet are not registered investment advisors and nothing in this article is intended to be investment advice.
Recommended Content
Editors’ Picks
Top 3 meme coins price prediction Dogecoin, Shiba Inu, Bonk: Memes face steeper correction than Bitcoin

Dogecoin eyes February lows after nearly 23% decline in the past seven days. Shiba Inu could plummet another 13% amid the broader crypto market correction. Bonk price is likely to regain lost ground as technical indicators point at recovery.
XRP sustains above $0.50 as traders digest news of Ripple XRP Ledger entry in the Japanese market

Ripple (XRP) sustained above $0.50, a key support level, on Wednesday. XRP price is down nearly 6% in the past ten days. The altcoin is in a confirmed downward trend, and wiped out all gains since February.
Optimism OP struggles to gain momentum despite alleged $90 million OP purchase by a16z
Venture capital firm a16z has purchased $90 million in OP tokens under a two-year vesting period, Unchained crypto reports. Sources told Unchained Crypto that Optimism has done well and the project is still doing airdrops.
Sei price action forecasts an opportunity to accumulate SEI Premium

Sei (SEI) price is at a crossroads and could trigger a steep correction or potential bounce after setting up an all-time high (ATH) of $1.145 roughly a month ago. Based on the Bitcoin price action, a potential bounce will likely occur anytime now.
Bitcoin: BTC’s next breakout could propel it to $80,000 Premium

Bitcoin’s (BTC) recent price consolidation could be nearing its end as technical indicators and on-chain metrics suggest a potential upward breakout. However, this move would not be straightforward and could punish impatient investors.