crypto technical
Crypto trading: My 5 technical tools
25 min
Introduction to the system
The toolbox: Resources for the trader
The technical analyst has at their disposal an extensive catalog of tools. All of them provide some kind of information, be it price direction, trend strength, setbacks, trend speed, and a thousand other things.
After many years of studying hundreds of them, I decided on two basic indicators, two simple averages and one exponential one.

In addition to these indicators and moving averages, I use trend lines that help me define scenarios and levels of support and resistance that I use to define target levels in my scenarios
Related content
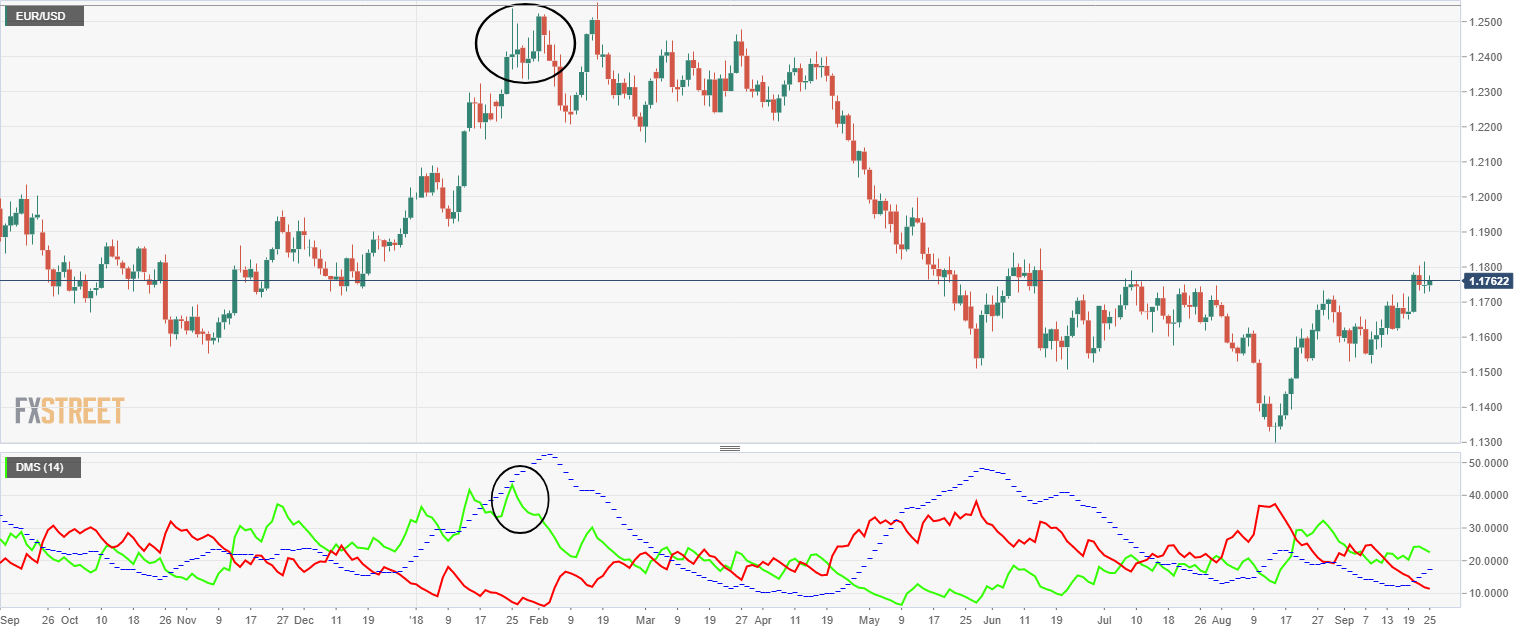
First, the MACD (Moving Average Convergence/ Divergence). It is an indicator that combines two measures on the price and interrupts them in an open range (Oscillator) with a medium reference point. The virtue of this oscillator is its simplicity and at the same time its fidelity in following certain behavior patterns.
As a second indicator, my choice was the DMI (Directional Movement Index). This indicator draws three different lines. The D+ indicates the level of activity of the bulls in a given period of time. The D- indicates the level of activity of the bears in a determined period of time. The ADX is an indicator that informs us about the level of trend strength in the market. As in the case of the MACD, the DMI is an indicator with very marked patterns and very reliable statistics.
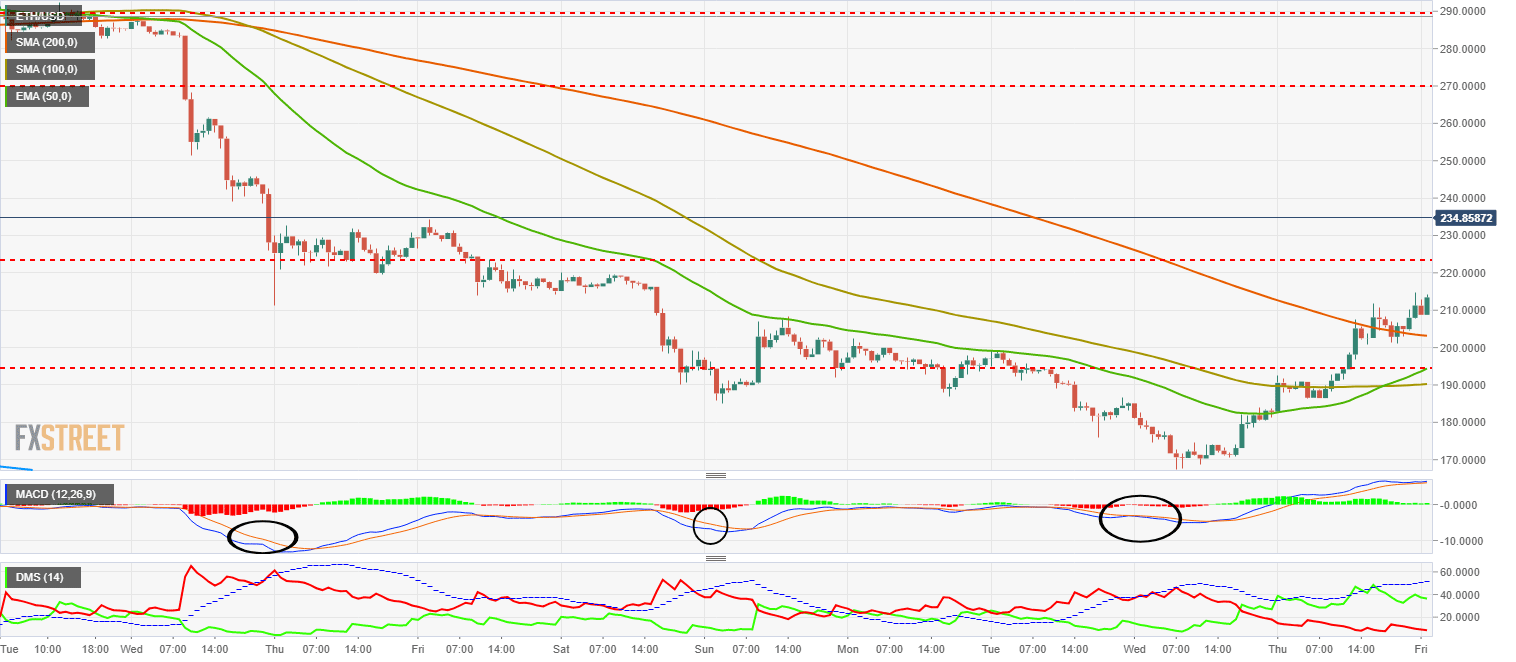
.png)
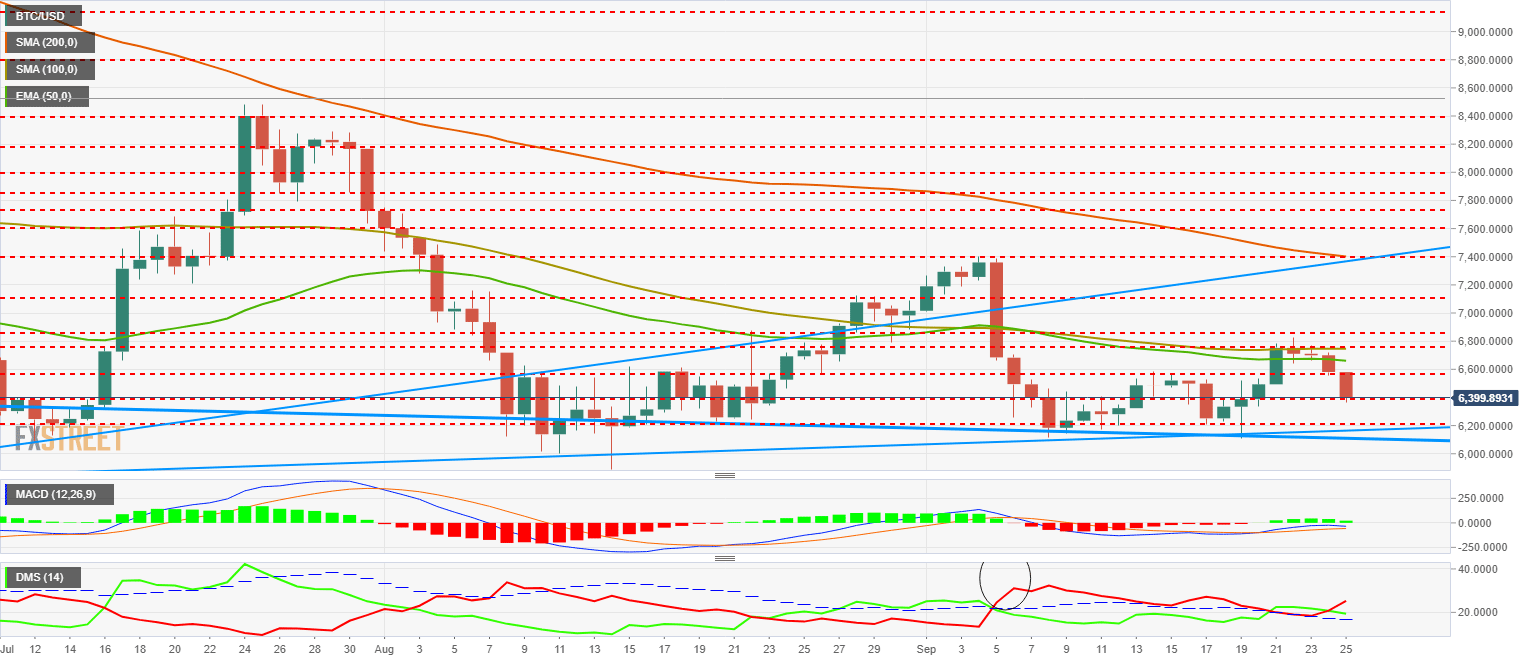
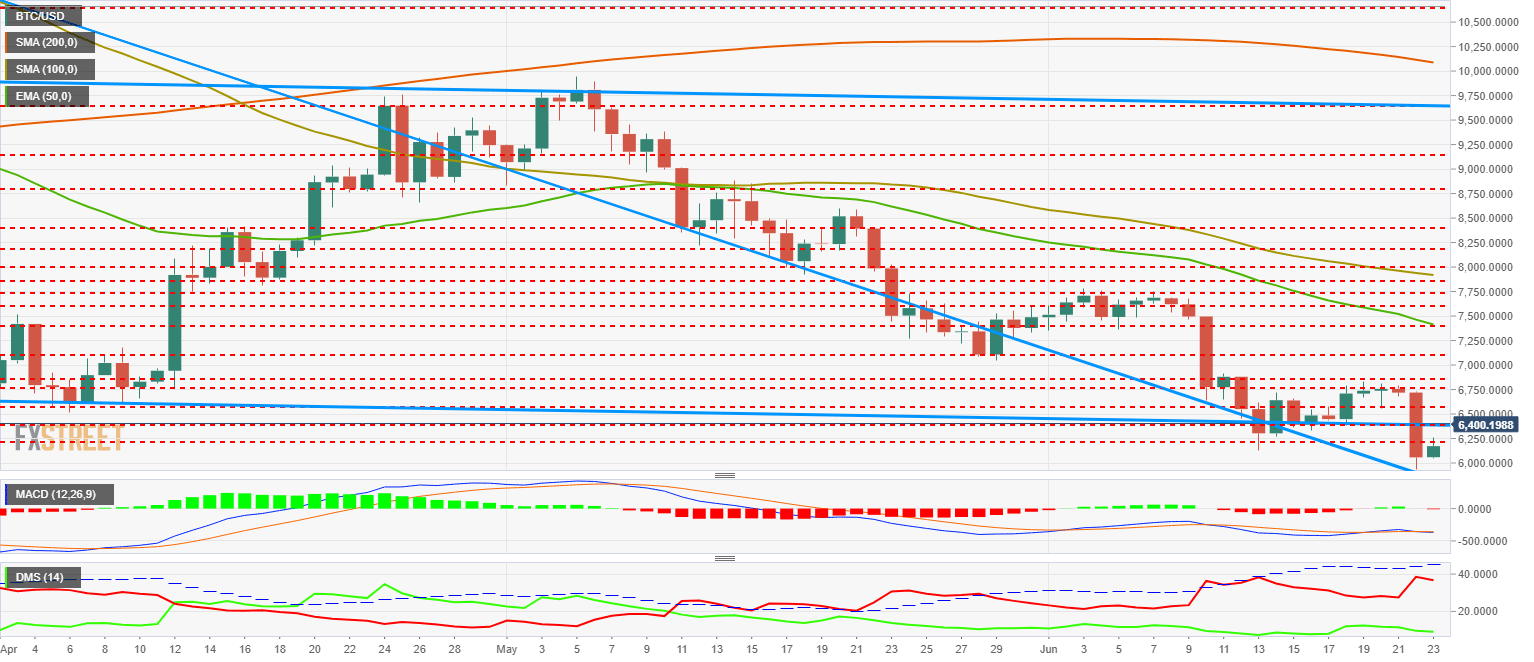
The set of moving averages, which are the SMA100, the SMA200, and the EMA50, I analyze them as a whole. In addition to being points of support and resistance, the set of moving averages gives us a lot of information if we analyze them as a whole. Are fast averages above or below the slow averages? Is the price above or below these averages?
The answers to these two questions will greatly help us to understand the market environment at any given time.
Finally, and as a valid tool for both Technical Analysis and trading, trend lines are the authentic validators of any scenario that we may raise. In the case of support and resistance lines, their effectiveness and validation capacity are similar.
Only the confirmed break of a trend line or of a horizontal support or resistance, understanding as confirmed that break with the candle closing, allows us to take a scenario as valid.
BEST CRYPTO BROKERS/EXCHANGES
The MACD
The MACD or Moving Average Divergence/Convergence is one of the most classic indicators in the world of technical analysis. It is a widely used indicator thanks to very distinct behavior patterns and very high reliability.
The behavior patterns of the MACD are:
- "MACD failure" or behavioural pattern by which statistically, the first attempt to cut the slow measure by the fast measure usually fails the attempt and is rejected. Therefore, statistically, the taking of positions after a first rejected attempt has a much better chance of entering at the right time.
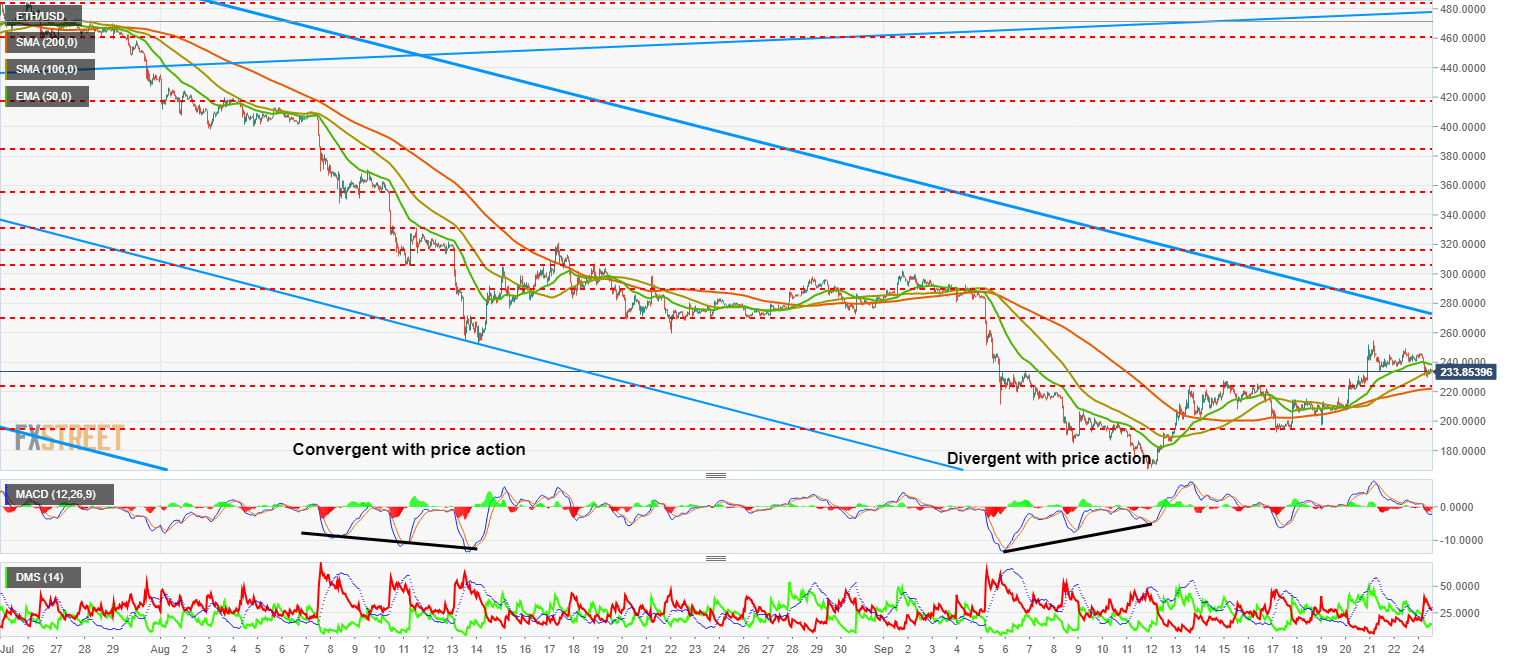
- "MACD Divergences" or pattern of behaviour in which after a relative maximum or minimum, both in price and in the level reached by the MACD, a new relative maximum or minimum occurs in the price that the MACD does not accompany. This pattern usually precedes, statistically, a market floor or ceiling, although the divergence situation can last for quite long.
The DMI
The DMI or Directional Movement Index is constructed by painting in the same space the DI+ or positive directional index, the DI- or negative directional index to build from these the third component that is the ADX or Average Directional Index.
The behavior patterns of the DMI are:
- Crossing D+ D-: The crossing of both components of the indicator follows a pattern whereby, statistically, after a long series of periods without crossing, the first one to occur will be quickly reversed. After this first rejection, a second cut will be statistically more reliable.
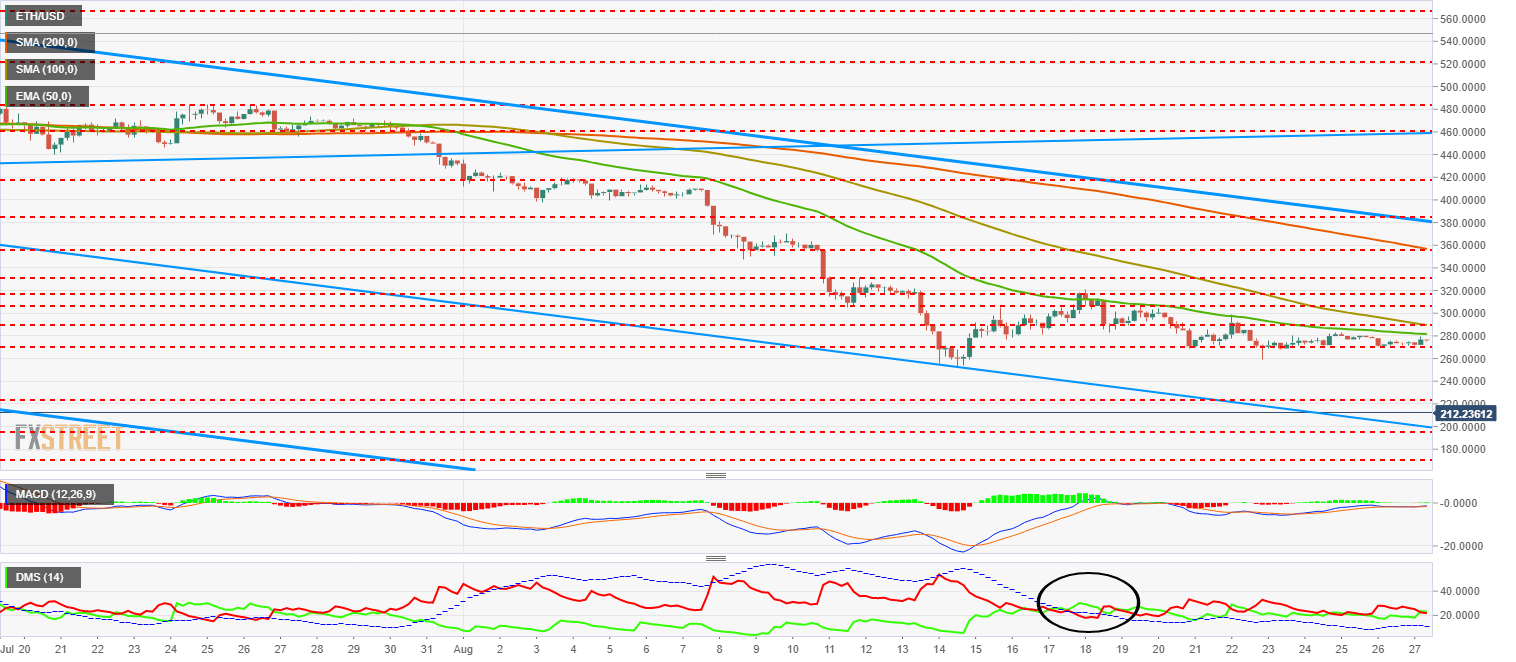
- Crossing D’s with the ADX: This cross occurs when one of the two components (D+ or D-) is above or below the ADX line and crosses this indicator and is above (coming from below) or below (coming from above). The point at which the component (D+ or D-) crosses the downward or upward ADX line should be studied as a position opening signal that should be validated by a break in the trend line, support or resistance.
- ADX Re-test: When there is a cut to the bottom of the ADX line, the behaviour pattern tells us that the component (D+ or D-) will try again to pass the ADX line and statistically, it will fail. The point at which the component (D+ or D-) touches below with the ADX line, gives the position opening signal.
Levels of support and resistance
Properly detecting price levels where the spot price will find it difficult to move represents an important advantage when establishing a trading strategy.
In order to be able to define these special price levels, I use a graphic with a representation of Japanese candles. All period types are valid, but in my case, I focus on three-time frames: weekly, daily and 4H. I carry out the analysis with all the available time depth since I consider that these price levels will last the test of time.
Starting with the broadest timeframe, which is the weekly one, I mark price levels where I see more closures or candle openings. I take the price queues, maximums, and minimums into account. After finishing the search on the weekly range, I repeat the process on the daily range and 4H.
Trend Lines
It is certainly difficult to agree on where and how to draw a trendline. Some professionals choose to pull the lines from the absolute minimums, others like me, we prefer to draw our trendlines always from the bodies of the candle, ie from the points of opening or closing.
When drawing from these points, the trendline is much closer to the price, so false breaks are more common. In my particular case, I value the validity of the breaks with the other components of my system.
A third option, valid for analysis but not suitable for trading, is to draw trend lines at the point where most candle closures and openings accumulate. In this way, we find guiding trend lines, on which the price pivots and where it ends up returning as long as the scenario that justified them remains valid.
What you need to know about Cryptocurrencies
How to choose a cryptocurrency wallet
 If you’re interested in using virtual coins like Bitcoin, Ethereum, Litecoin or any other out the over 1,500 coins and tokens currently available on the market, you’re going to need a wallet. If you are new to cryptos, this guide is your shortcut to understanding what a cryptocurrency wallet is, how they work and which one suits you best.
27 min Beginners Beginners
Best cryptocurrency exchanges in 2018
 Factors to consider when choosing a cryptocurrency exchange The boom of cryptocurrencies resulted in a boom of crypto exchanges. If you search Google for the term, you may drown in offers, and the possibilities seem endless. So how do you find the perfect match?
When choosing a crypto-exchange, there are many factors to consider, factors that will help you narrow down the options and find the best one.
Factors to consider when choosing a cryptocurrency exchange The boom of cryptocurrencies resulted in a boom of crypto exchanges. If you search Google for the term, you may drown in offers, and the possibilities seem endless. So how do you find the perfect match?
When choosing a crypto-exchange, there are many factors to consider, factors that will help you narrow down the options and find the best one.
16 min Beginners Beginners
-
Coinbase,
Binance or Coincheck down for maintenance? Top 4 scenarios and how to deal with crypto exchange problems -
Cryptocurrency vs fiat currency: What does fiat mean and three main differences to consider
-
How to Choose a Cryptocurrency Broker? Brokers that offer cryptos
-
How to buy cryptocurrencies: Coinbase, Coinbase Pro, Kraken, Bitstamp vs Brokers
-
Best cryptocurrency exchanges to buy Bitcoin, Ethereum, Ripple and Litecoin in 2018
-
What are Bitcoin Futures: Trading on a regulated market
The information provided by FXStreet does not constitute investment or trading advice and should be just treated for informational purposes. Our content may also include affiliate links or advertising from other websites, however we are not responsible or liable for any actions of other websites. Investing in Cryptocurrencies involves a great deal of risk, including the loss of all your investment, as well as emotional distress.