- Chances of bearish scenarios have been increasing and may now extend to the medium term.
- Ethereum enjoys better short-term prospects in the short term amid a rotation process.
- XRP’s technical situation has been deteriorating and it is at risk of a falling sharply.
The weekend is here, and it seems that the negative post-holiday effect – typical of stock markets – is affecting cryptocurrencies.
This seasonal pattern is sustained by the positive emotions of individuals in the days before a holiday in contrast to the emotional situation in the following days.
Bitcoin had already pierced essential supports in previous days but recovered later. Its companions on the Crypto podium held up in their higher ranges.
However, the hangover after the 4th of July comes into play and impacts the market. Ethereum has slipped below $290, and XRP moves into the low range and seeking the SMA100, firing the signal to start developing a second bearish leg.
With these falls, the consolidation process opens a new scenario that will last somewhat more than expected.
But not all is lost. Opportunities show up from time to time.
ETH/BTC Daily Chart
The ETH/BTC crypto cross kicks off the day by drawing a remarkable bullish candlestick that starts from support levels and attracts the attention of the market. Traders see it as an opportunity to take positions with a significant Beta against Bitcoin.
In long-term strategies, the profit potential of taking positions seeking to increase net value in Bitcoins is very profitable. Opportunities like the current one with Ethereum which is at the lows versus Bitcoin offers a considerable profit potential with a reasonably controlled risk.
From the current level between 0.0255 and 0.026, the revaluation potential related to Bitcoin is 90% – with a price target of 0.04 in a first phase – being able to extend up to 275% and targeting in 0.070 in the long term.
ETH/BTC is quoted at 0.0259 and seems to be trying to draw a bullish figure back after the doji drawn yesterday. To confirm the pattern, ETH/BTC will only need to close above 0.0269. However, a close above 0.0271 would be preferable.
Above the current price, the first resistance level is at 0.0269 (price congestion resistance), then the second at 0.0276 (price congestion resistance) and the third one at 0.029 (EMA50 and price congestion resistance).
Below the current price, the first support level is at 0.025 (price congestion support), then the second at 0.0227 (price congestion support) and the third one at 0.020 (price congestion support).
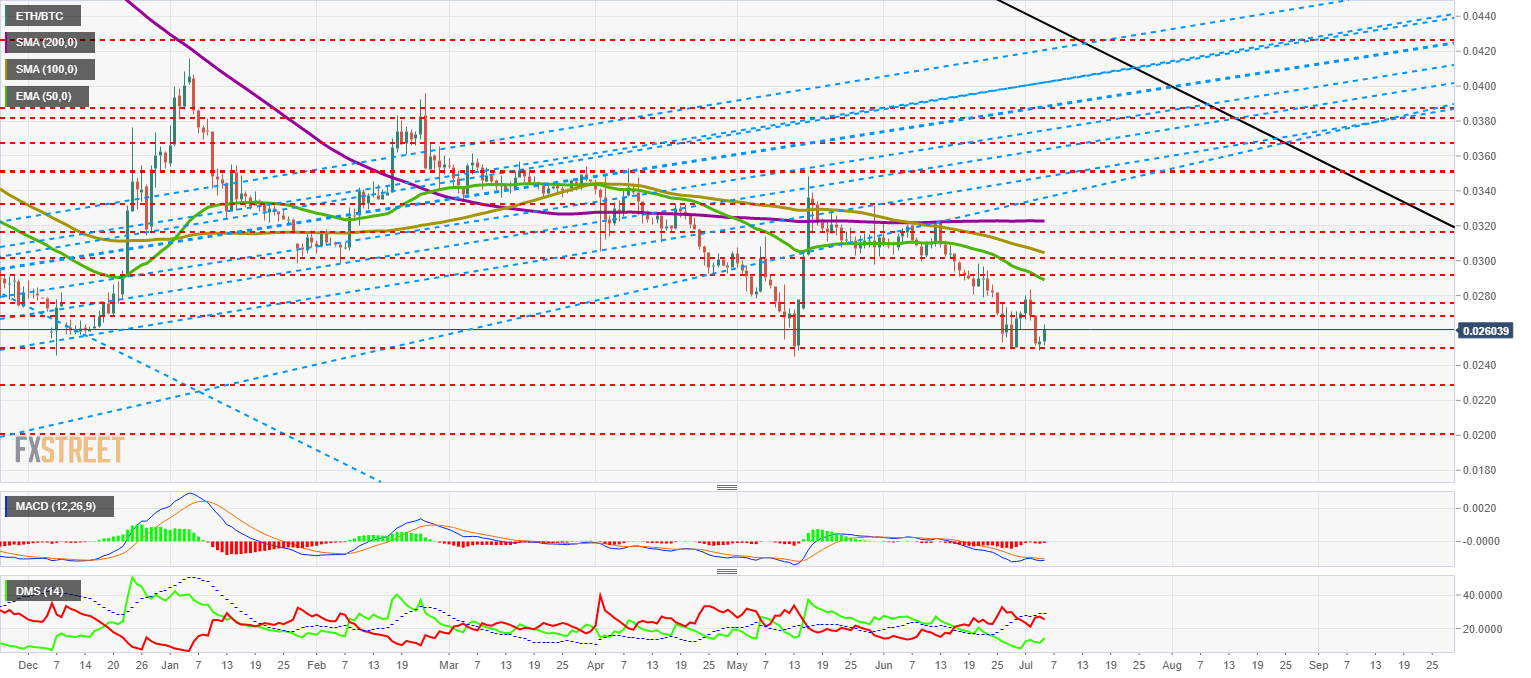
The MACD on the daily chart shows a bullish cutting pattern with a high chance of success. A close to 0.027 would confirm the cut.
The DMI on the daily chart shows how the bulls have increased their activity in the double bottom zone, which is potentially bullish. This positive data reinforces the opposite effect on bears, which decrease their trend strength when they reach these levels.
BTC/USD Daily Chart
BTC/USD is trading at $11,203 and meets yesterday's prediction based on the MACD's failure to cross higher.
Above the current price the first resistance level is at $11,314 (price congestion resistance), then the second at $14,000 (price congestion resistance) and the third one at $17,000 (price congestion resistance).
Below the current price, the first level of support is at $10,600 (price congestion support), then the second at $9,700 (price congestion support) and the third one at $9,150 (EMA50 and price congestion support).
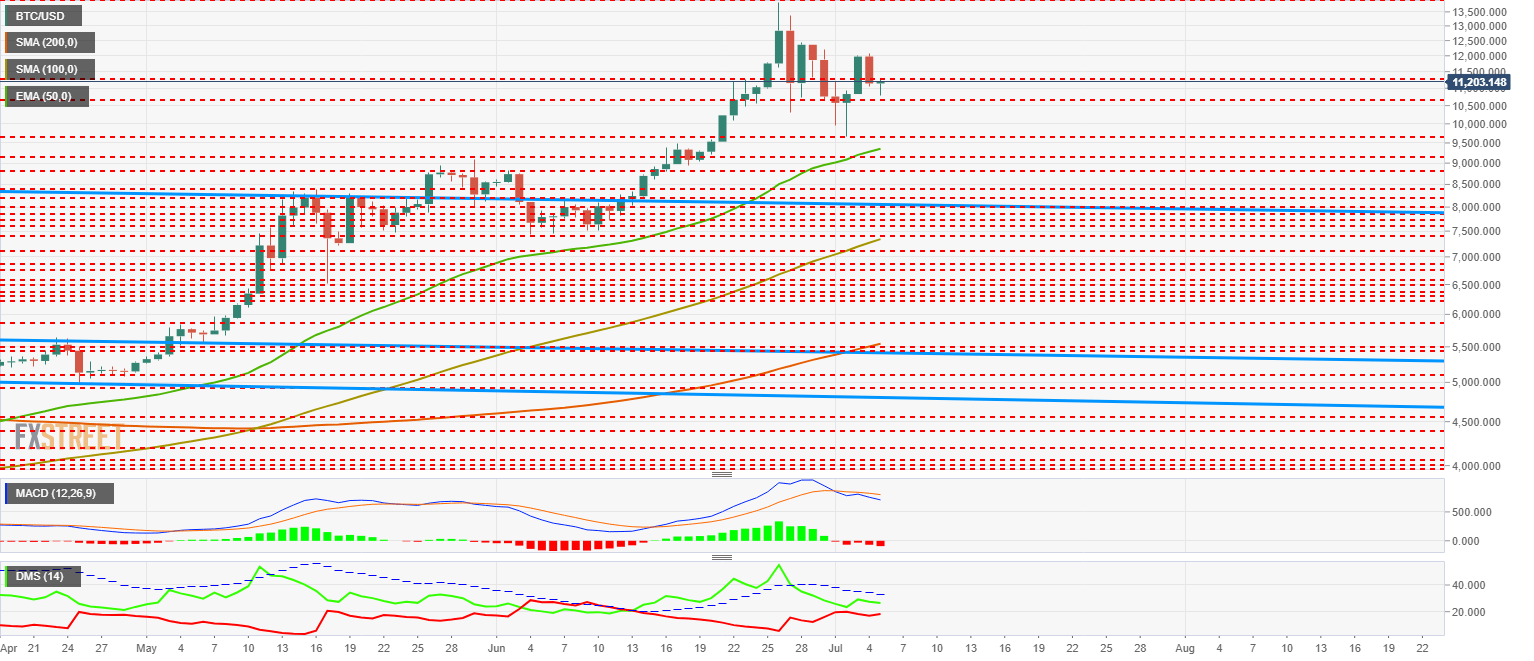
The MACD on the daily chart shows how the bearish cross accelerates after Wednesday's test. The most likely pattern suggests an acceleration of the bearish movement.
The DMI on the daily chart clearly shows us how the bears have been increasing their strength for days while the bulls – despite maintaining control – are withdrawing progressively. This decrease in activity on the buyer side will intensify in the coming days.
ETH/USD Daily Chart
ETH/USD trades at $292 and is losing significant support for price congestion at $290. Ethereum is up today, resisting Bitcoin’s falls. It continues demonstrating its resilience.
Above the current price, the first resistance level is at $290 (price congestion resistance), then the second at $305 (price congestion resistance) and the third one at $318 (price congestion resistance).
Below the current price, the first level of support is at $260 (EMA50 and price congestion support), then the second at $250 (price congestion support) and the third one at $238 (price congestion support).
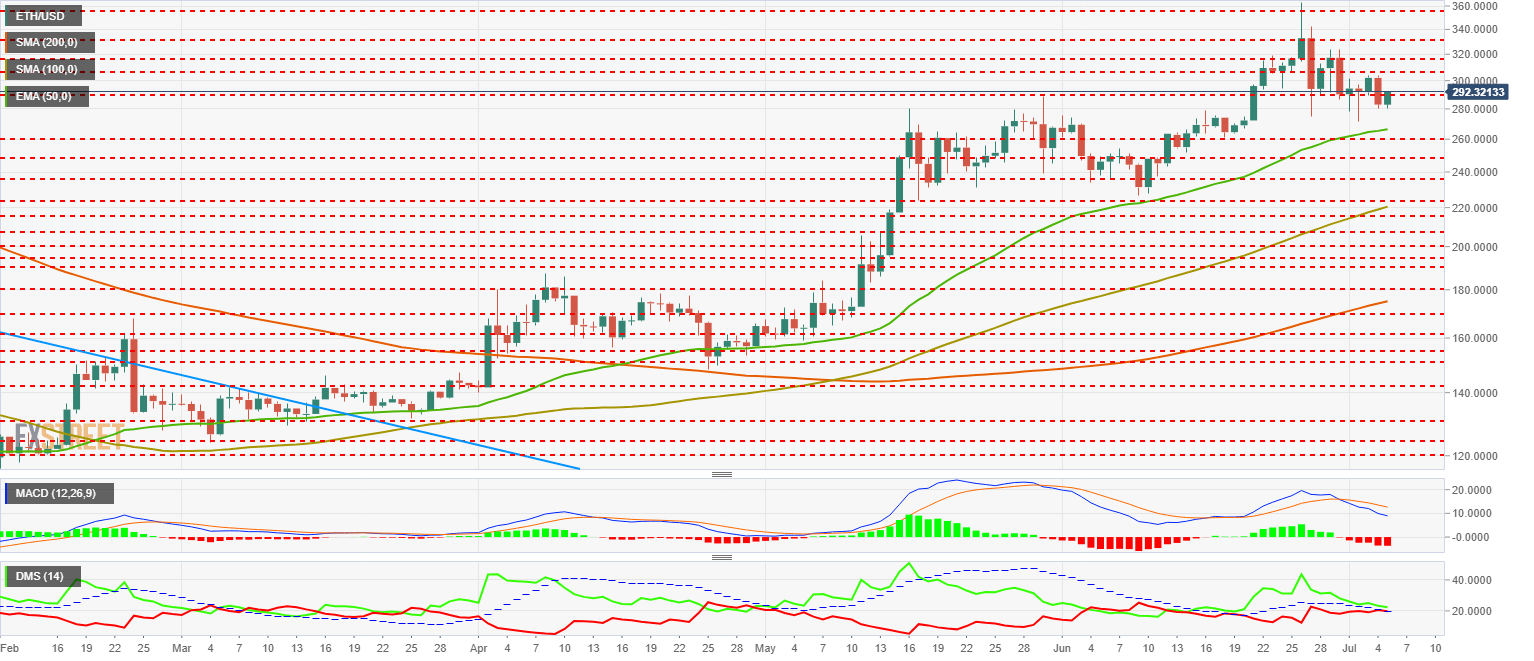
The MACD on the daily chart shows a bearish structure at an intermediate stage of development. The pattern is ambiguous and can both continue to fall and begin to turn upside down.
The DMI on the daily chart continues to show the bulls at an advantage, although it is now minimal. The bears are placed above the ADX line and are increasing their chances of success.
XRP/USD Daily Chart
XRP/USD is changing hands at $0.382 after it failed to top the EMA50. The day's trough is also below the SMA100 and deepens its downside drift.
Above the current price, the first resistance level is at $0.39 (price congestion resistance), then the second at $0.41 (EMA50 and price congestion resistance) and the third one at $0.428 (price congestion resistance).
Below the current price, the first level of support is at $0.367 (double price congestion support and SMA100), then the second at $0.344 (price congestion support) and the third one at $0.334 (price congestion support).
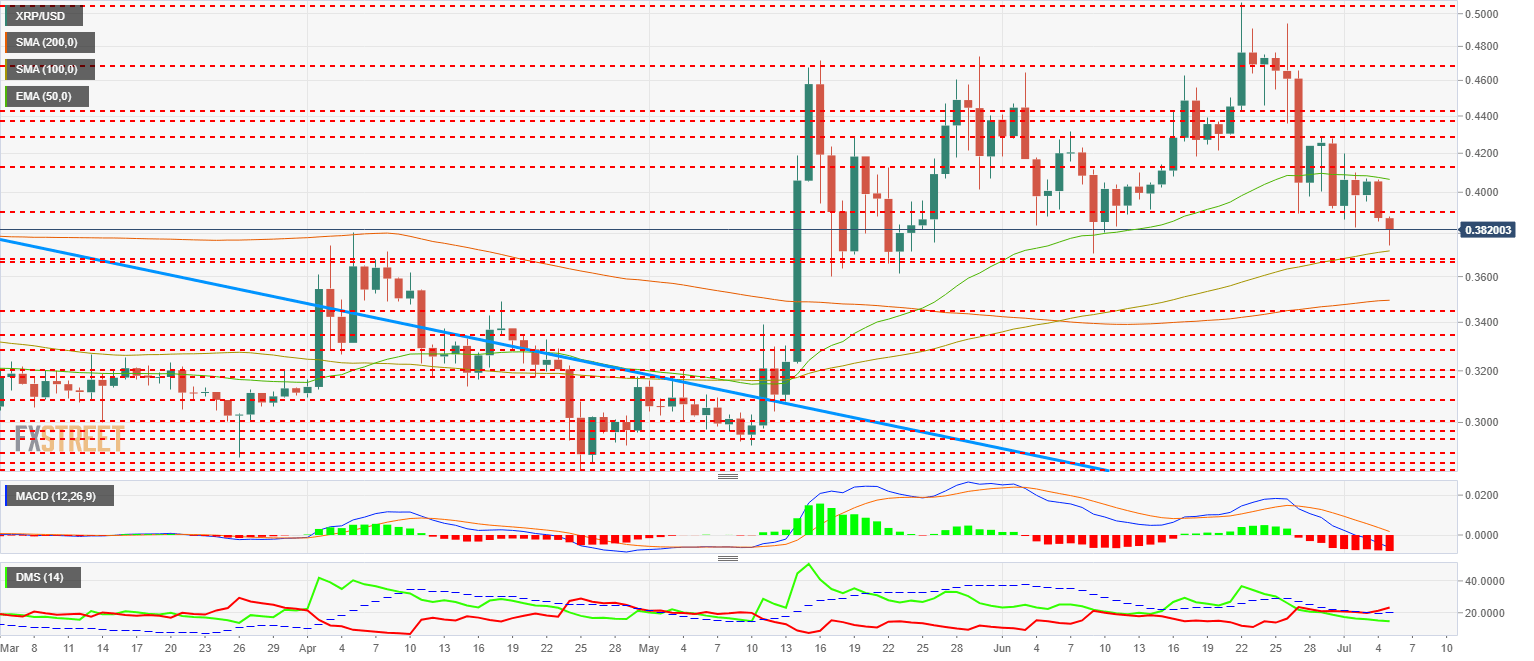
The MACD on the daily chart widens the bearish profile and deepens the negative zone of the indicator. The current setup proposes bearish continuity, being possible to look for levels close to 0.30.
The DMI in the daily chart shows how the bears manage to put themselves in command of the market and exceed the ADX line, which augurs an extended downward trajectory.
Get 24/7 Crypto updates in our social media channels: Give us a follow at @FXSCrypto and our FXStreet Crypto Trading Telegram channel
Information on these pages contains forward-looking statements that involve risks and uncertainties. Markets and instruments profiled on this page are for informational purposes only and should not in any way come across as a recommendation to buy or sell in these assets. You should do your own thorough research before making any investment decisions. FXStreet does not in any way guarantee that this information is free from mistakes, errors, or material misstatements. It also does not guarantee that this information is of a timely nature. Investing in Open Markets involves a great deal of risk, including the loss of all or a portion of your investment, as well as emotional distress. All risks, losses and costs associated with investing, including total loss of principal, are your responsibility. The views and opinions expressed in this article are those of the authors and do not necessarily reflect the official policy or position of FXStreet nor its advertisers. The author will not be held responsible for information that is found at the end of links posted on this page.
If not otherwise explicitly mentioned in the body of the article, at the time of writing, the author has no position in any stock mentioned in this article and no business relationship with any company mentioned. The author has not received compensation for writing this article, other than from FXStreet.
FXStreet and the author do not provide personalized recommendations. The author makes no representations as to the accuracy, completeness, or suitability of this information. FXStreet and the author will not be liable for any errors, omissions or any losses, injuries or damages arising from this information and its display or use. Errors and omissions excepted.
The author and FXStreet are not registered investment advisors and nothing in this article is intended to be investment advice.
Recommended Content
Editors’ Picks

Bitcoin Weekly Forecast: Fed-led rally could have legs towards $65,000
Bitcoin has risen 7% so far this week, supported by the US Fed interest-rate cut and more than $300 million in ETFs inflows. The recent surge led BTC price to shatter several key technical resistance levels, a sign that the current two-week rally has likely some more way to go towards $65,000.

Ethereum, BNB and POL holders on the watch as BingX faces loss of $26 million in hack
Crypto exchange BingX said on Friday that it suffered a hack, an attack that led to “minimal” losses that researchers at PeckShield estimate at $26.68 million. The attacker swapped the stolen altcoins for Ethereum, Binance Coin and Polygon tokens, according to on-chain data.

Pepe price forecast: Eyes for 30% rally
Pepe extends the upward movement on Friday after breaking above the descending trendline and resistance barrier on Thursday. PEPE’s dormant wallets are in motion, and the long-to-short ratio is above one, further supporting this bullish move and hinting at a rally on the horizon.

Shiba Inu is poised for a rally as price action and on-chain metrics signal bullish momentum
Shiba Inu remains strong on Friday after breaking above a symmetrical triangle pattern on Thursday. This breakout signals bullish momentum, further bolstered by a rise in daily new transactions that suggests a potential rally in the coming days.

Bitcoin: On the road to $60,000
Bitcoin price retested and bounced off from the daily support level of $56,000 this week. US spot Bitcoin ETFs posted $140.7 million in inflows until Thursday and on-chain data supports a bullish outlook.

Moneta Markets review 2024: All you need to know
VERIFIED In this review, the FXStreet team provides an independent and thorough analysis based on direct testing and real experiences with Moneta Markets – an excellent broker for novice to intermediate forex traders who want to broaden their knowledge base.