- Bitcoin enters the bullish zone but slips below support along the way.
- ETH/BTC receives a heavy punishment and loses bullish momentum.
- XRP continues to play alone and so must find the way to heaven.
It is almost usual practice of the Crypto market that technical extremes occur at the end of the working week – setting the stage for action over the weekend.
To comply with this custom, Bitcoin kicks off the day just above the long term bearish channel. For now, it has been unable to escape the bearish scenario – and after Altcoins dropped in the morning – it remains alone beyond the wall.
The first condition to declare a bullish Crypto market has been fulfilled. But, as could not be otherwise, Altcoins suffer a generalized downturn and spoil what could have been the most awaited "long" signal of the year.
So, there is no room to rest during the weekend and our colleague John Isige will keep you up to date on any development.
In today’s ETH/BTC analysis – the Altcoin sector barometer – shows how It drew a bearish cover candle yesterday, thus sending ETH/BTC back to the bearish scenario and disappointing market expectations.
ETH/BTC Daily Chart
ETH/BTC is trading at the price level of 0.0309, losing EMA50 support. The miserable failure to break the 200-day SMA is an essential sign of weakness.
It is true that the bullish zone is close and the situation can change very quickly. As I explain below in the MACD and DMI analysis, the market background for ETH/BTC is very positive.
Above the current price, the first resistance is a strong confluence between 0.0311 and 0.03225 and composed, ordered from bottom to top by the:
- EMA50
- Upper parallel uptrend line
- Price congestion resistance
- SMA100
- SMA200
The second resistance level is at 0.0332 (price congestion resistance), and the third one for ETH/BTC is at 0.0339 (second upper parallel trend line).
Below the current price, the first support level of support for ETH/BTC is at 0.0301 (price congestion support), then the second at 0.0291 (price congestion support) and the third one at 0.0275 (price congestion support).
-636961033922123213.png)
The MACD on the daily chart holds onto the bullish zone, although with a slight downtrend. The lack of volatility is excessively flattening the indicators and causes future visibility to be zero. It is likely to come out of this situation with violence.
The DMI on the daily chart shows bulls dominating the market with ease and staying above the ADX line. The bears are weak and do not take advantage of yesterday's ugly figure to increase activity.
BTC/USD Daily Chart
The BTC/USD trades at the price level of $8,287. Despite getting through the wall and into the bullish zone, the lack of support from the Altcoin segment weighs heavily on the overall tone of the market.
Above the current price, the first resistance level is at $8,450; then the second is at $8,750 and the third at $9,150. All three resistance levels are due to price congestion.
Below the current price, the first support level is at $8,250 (confluence of price congestion support and long term down channel trendline ceiling). Then the second one would be again in a sub-$8,000 bearish scenario (price congestion support). Below $7,500 it would lose the bullish momentum and we could see the BTC/USD pair at the $5,500 level.
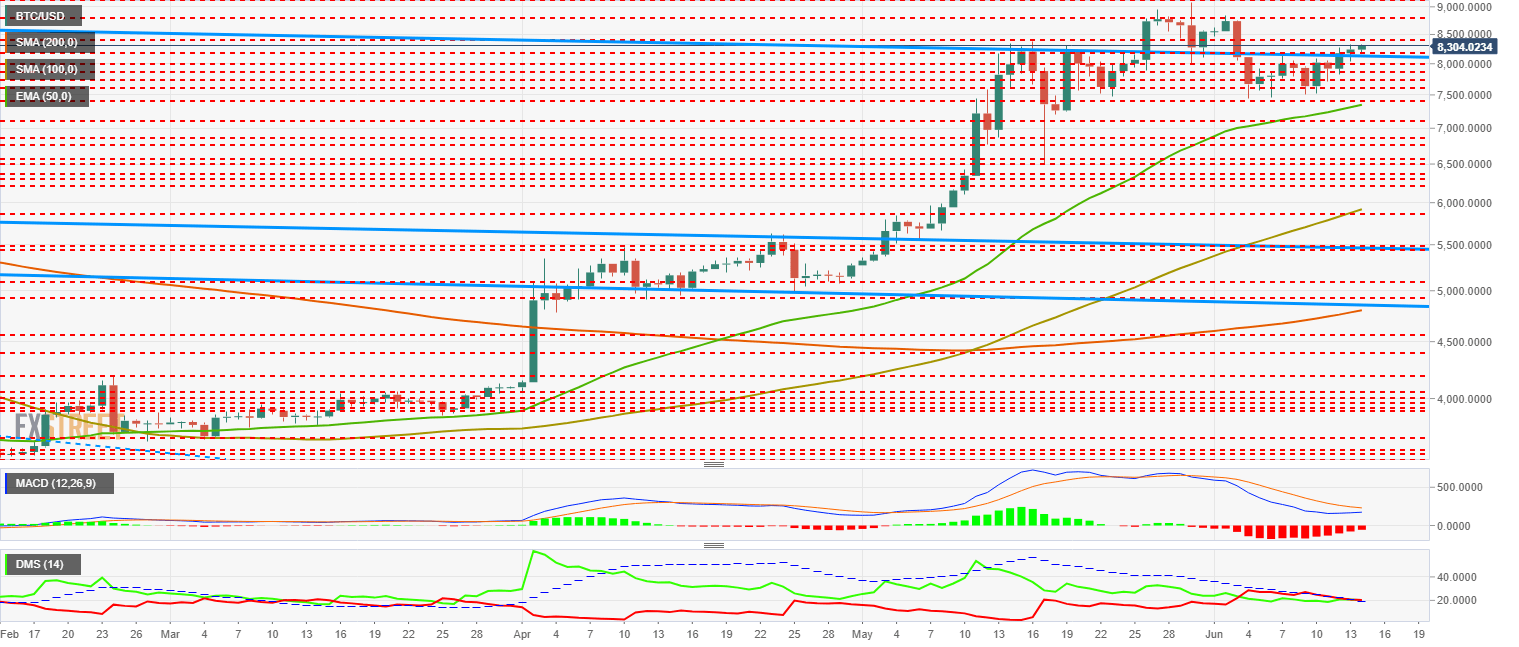
The MACD on the daily chart shows a structure hinting of a bullish cross attempt. This construction type usually causes a downward rebound – which due to the proximity of key supports – can be dangerous for short-term development.
The DMI on the daily chart shows a tie between the bulls and the bears. Both sides of the market are above the ADX, which frees them from obstacles if they are to move quickly.
ETH/USD Daily Chart
ETH/USD trades at $256.6, remaining within the range it has been since May 17.
Above the current price, the first three resistance levels are $260, then at $290 and finally at $305. All three levels have been generated by the congestion of close and open levels on the daily range in recent months.
Below the current price, the first support level is $250 (price congestion support), then the second support level is $235 (price congestion support). The third one is at $228 (EMA50).
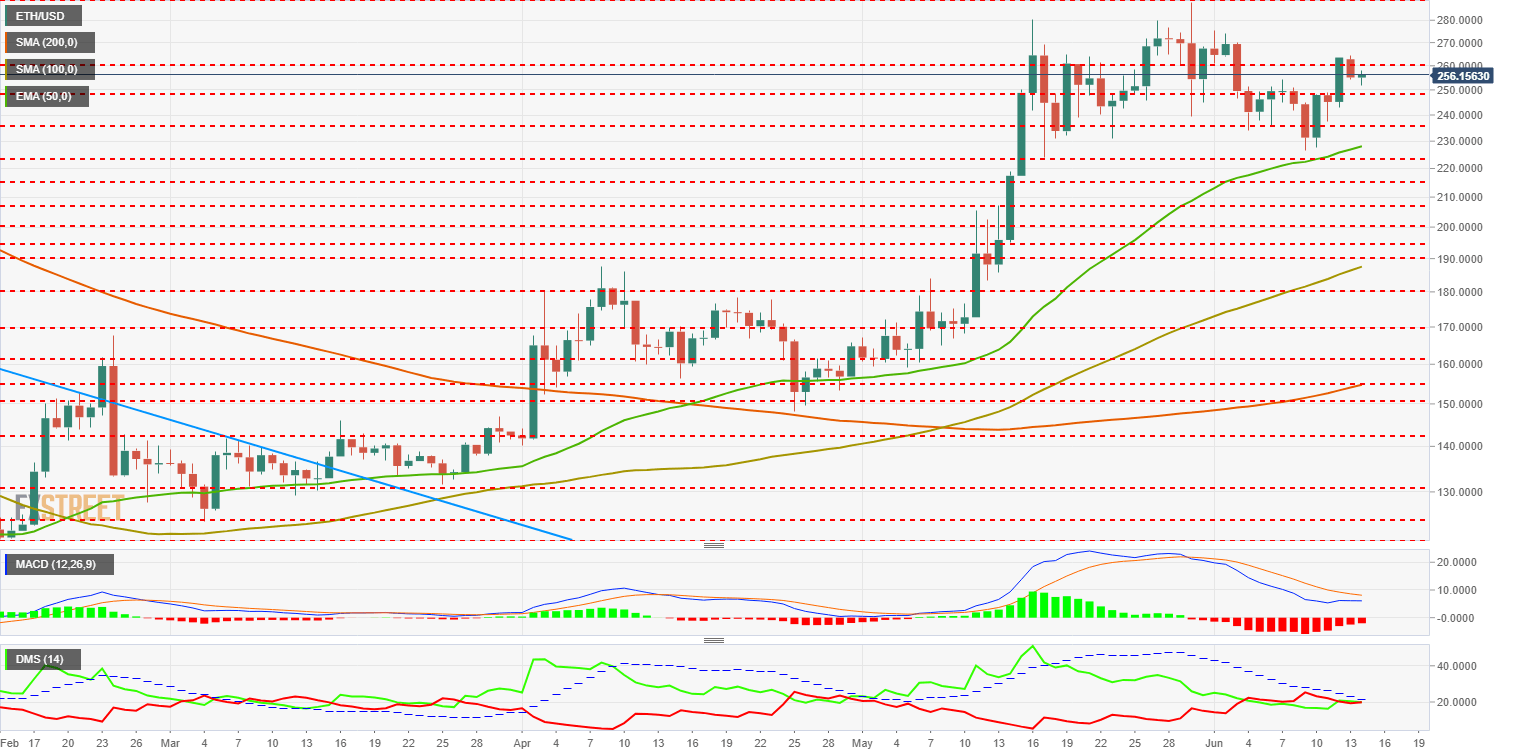
The MACD on the daily chart shows a neutral structure with a bullish cross tendency. It is a figure that has little chance of developing a clean upward movement.
The DMI in the daily chart shows – as in Bitcoin’s case – a tie between the two sides of the market. However, in this case below the ADX line, which complicates a possible exit by either side of the market.
XRP/USD Daily Chart
XRP/USD trades at the $0.397 price level and continues to develop a bullish flag. It now enters the last third of the figure, which usually coincides with a bullish break.
Above the current price, the first two resistance levels are $0.412 and $0.428 (price congestion resistance). The third resistance level for the XRP/USD pair is at $0.432 and formed by the top line of the technical figure.
Below the current price, the first support level is $0.39 (price congestion support, EMA50, and technical figure bottom line). The second support level is $0.369 (double price congestion support), and the third one is $0.0345 (price congestion support).
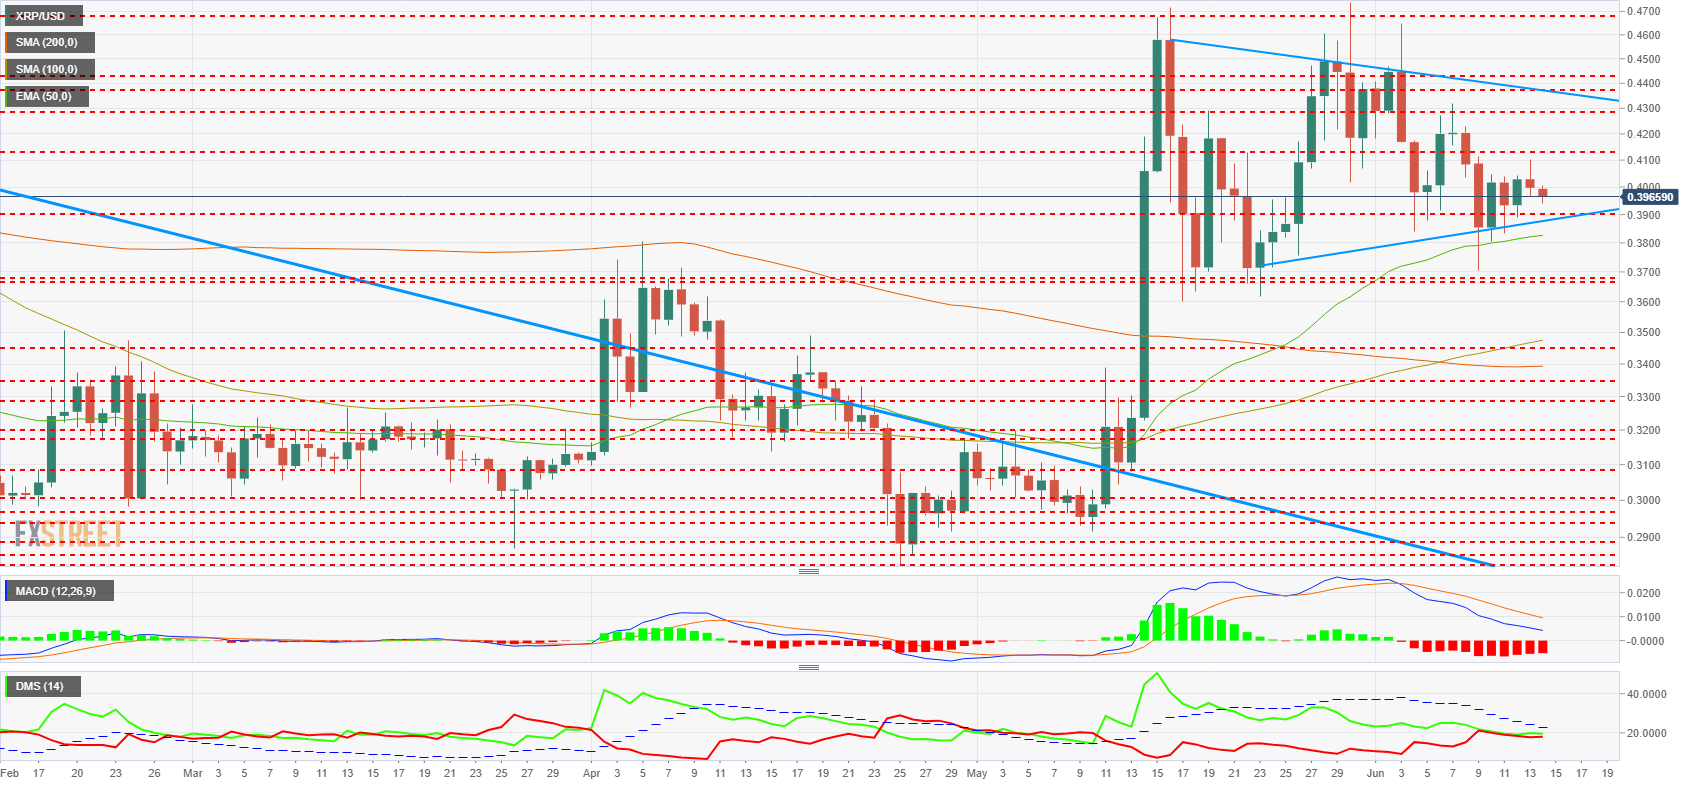
The MACD on the daily chart shows a bearish profile and promises price weakness in the short term.
The DMI on the daily chart also shows a tie between both sides of the market and below both of the ADX line. The breakage of the flag figure will mark the development of the next few weeks.
Information on these pages contains forward-looking statements that involve risks and uncertainties. Markets and instruments profiled on this page are for informational purposes only and should not in any way come across as a recommendation to buy or sell in these assets. You should do your own thorough research before making any investment decisions. FXStreet does not in any way guarantee that this information is free from mistakes, errors, or material misstatements. It also does not guarantee that this information is of a timely nature. Investing in Open Markets involves a great deal of risk, including the loss of all or a portion of your investment, as well as emotional distress. All risks, losses and costs associated with investing, including total loss of principal, are your responsibility. The views and opinions expressed in this article are those of the authors and do not necessarily reflect the official policy or position of FXStreet nor its advertisers. The author will not be held responsible for information that is found at the end of links posted on this page.
If not otherwise explicitly mentioned in the body of the article, at the time of writing, the author has no position in any stock mentioned in this article and no business relationship with any company mentioned. The author has not received compensation for writing this article, other than from FXStreet.
FXStreet and the author do not provide personalized recommendations. The author makes no representations as to the accuracy, completeness, or suitability of this information. FXStreet and the author will not be liable for any errors, omissions or any losses, injuries or damages arising from this information and its display or use. Errors and omissions excepted.
The author and FXStreet are not registered investment advisors and nothing in this article is intended to be investment advice.
Recommended Content
Editors’ Picks

Bitcoin is showing rising correlation with the S&P 500
Bitcoin and the crypto market have been in an uptrend since Wednesday following the Federal Reserve's decision to cut interest rates by 50 basis points. Bitcoin is up nearly 3% in the past 24 hours, rising briefly above the $63,000 level for the first time in three weeks.

Ethereum rallies over 6% following decision to split Pectra upgrade into two phases
In its Consensus Layer Call on Thursday, Ethereum developers decided to split the upcoming Pectra upgrade into two batches. The decision follows concerns about potential risks in shipping the previously approved series of Ethereum improvement proposals.

Consensys case against SEC over Ethereum dismissed by Texas court
Consensys announced dismissal of a case it filed against the SEC in April about the agency's alleged actions against Ethereum. Judge Reed O'Connor of the Northern District of Texas dismissed the case on Thursday. Consensys claims that the court failed to examine the "merits" of its claim against the SEC.

XRP eyes gains as Ripple gears up for stablecoin launch, Grayscale XRP Trust notes rising NAV
Ripple (XRP) gained 2.3% since the start of the week. The altcoin’s gains are likely powered by key market movers that include Ripple USD stablecoin, Grayscale XRP Trust performance and the demand for the altcoin among institutional investors.

Bitcoin: On the road to $60,000
Bitcoin price retested and bounced off from the daily support level of $56,000 this week. US spot Bitcoin ETFs posted $140.7 million in inflows until Thursday and on-chain data supports a bullish outlook.

Moneta Markets review 2024: All you need to know
VERIFIED In this review, the FXStreet team provides an independent and thorough analysis based on direct testing and real experiences with Moneta Markets – an excellent broker for novice to intermediate forex traders who want to broaden their knowledge base.