Top 3 Price Prediction Bitcoin, Ethereum, XRP: Crypto shows signs of bouncing in May
- Bitcoin price lost nearly 19% of its value in April, but a recovery may be starting.
- Ethereum price action continues to chop and whipsaw investors and traders alike.
- XRP price hits an all-time low in a critical oscillator measurement.

Bitcoin price ends April on a bearish note, with concerns that further downside pressure may continue. Ethereum price continues to vex bulls and bears alike as ETH maintains a tight trading range. XRP price struggle to hold the $0.60 value area.
Bitcoin price action displays several potential bullish reversal signals
Bitcoin price action begins May after a brutal sell-off in April. Historically, April is one of the best-performing months for Bitcoin. April of 2022, however, goes down as the worst-performing April in Bitcoin’s history and the worst performing month since May 2021.
Several warning signs now exist for bears. First, the most powerful standard bullish reversal pattern, the falling wedge, is now present on the daily Bitcoin price chart. The falling wedge has a high positive expectancy rate of reversing price action into a broad trend change or, at the very least, a powerful corrective move higher.
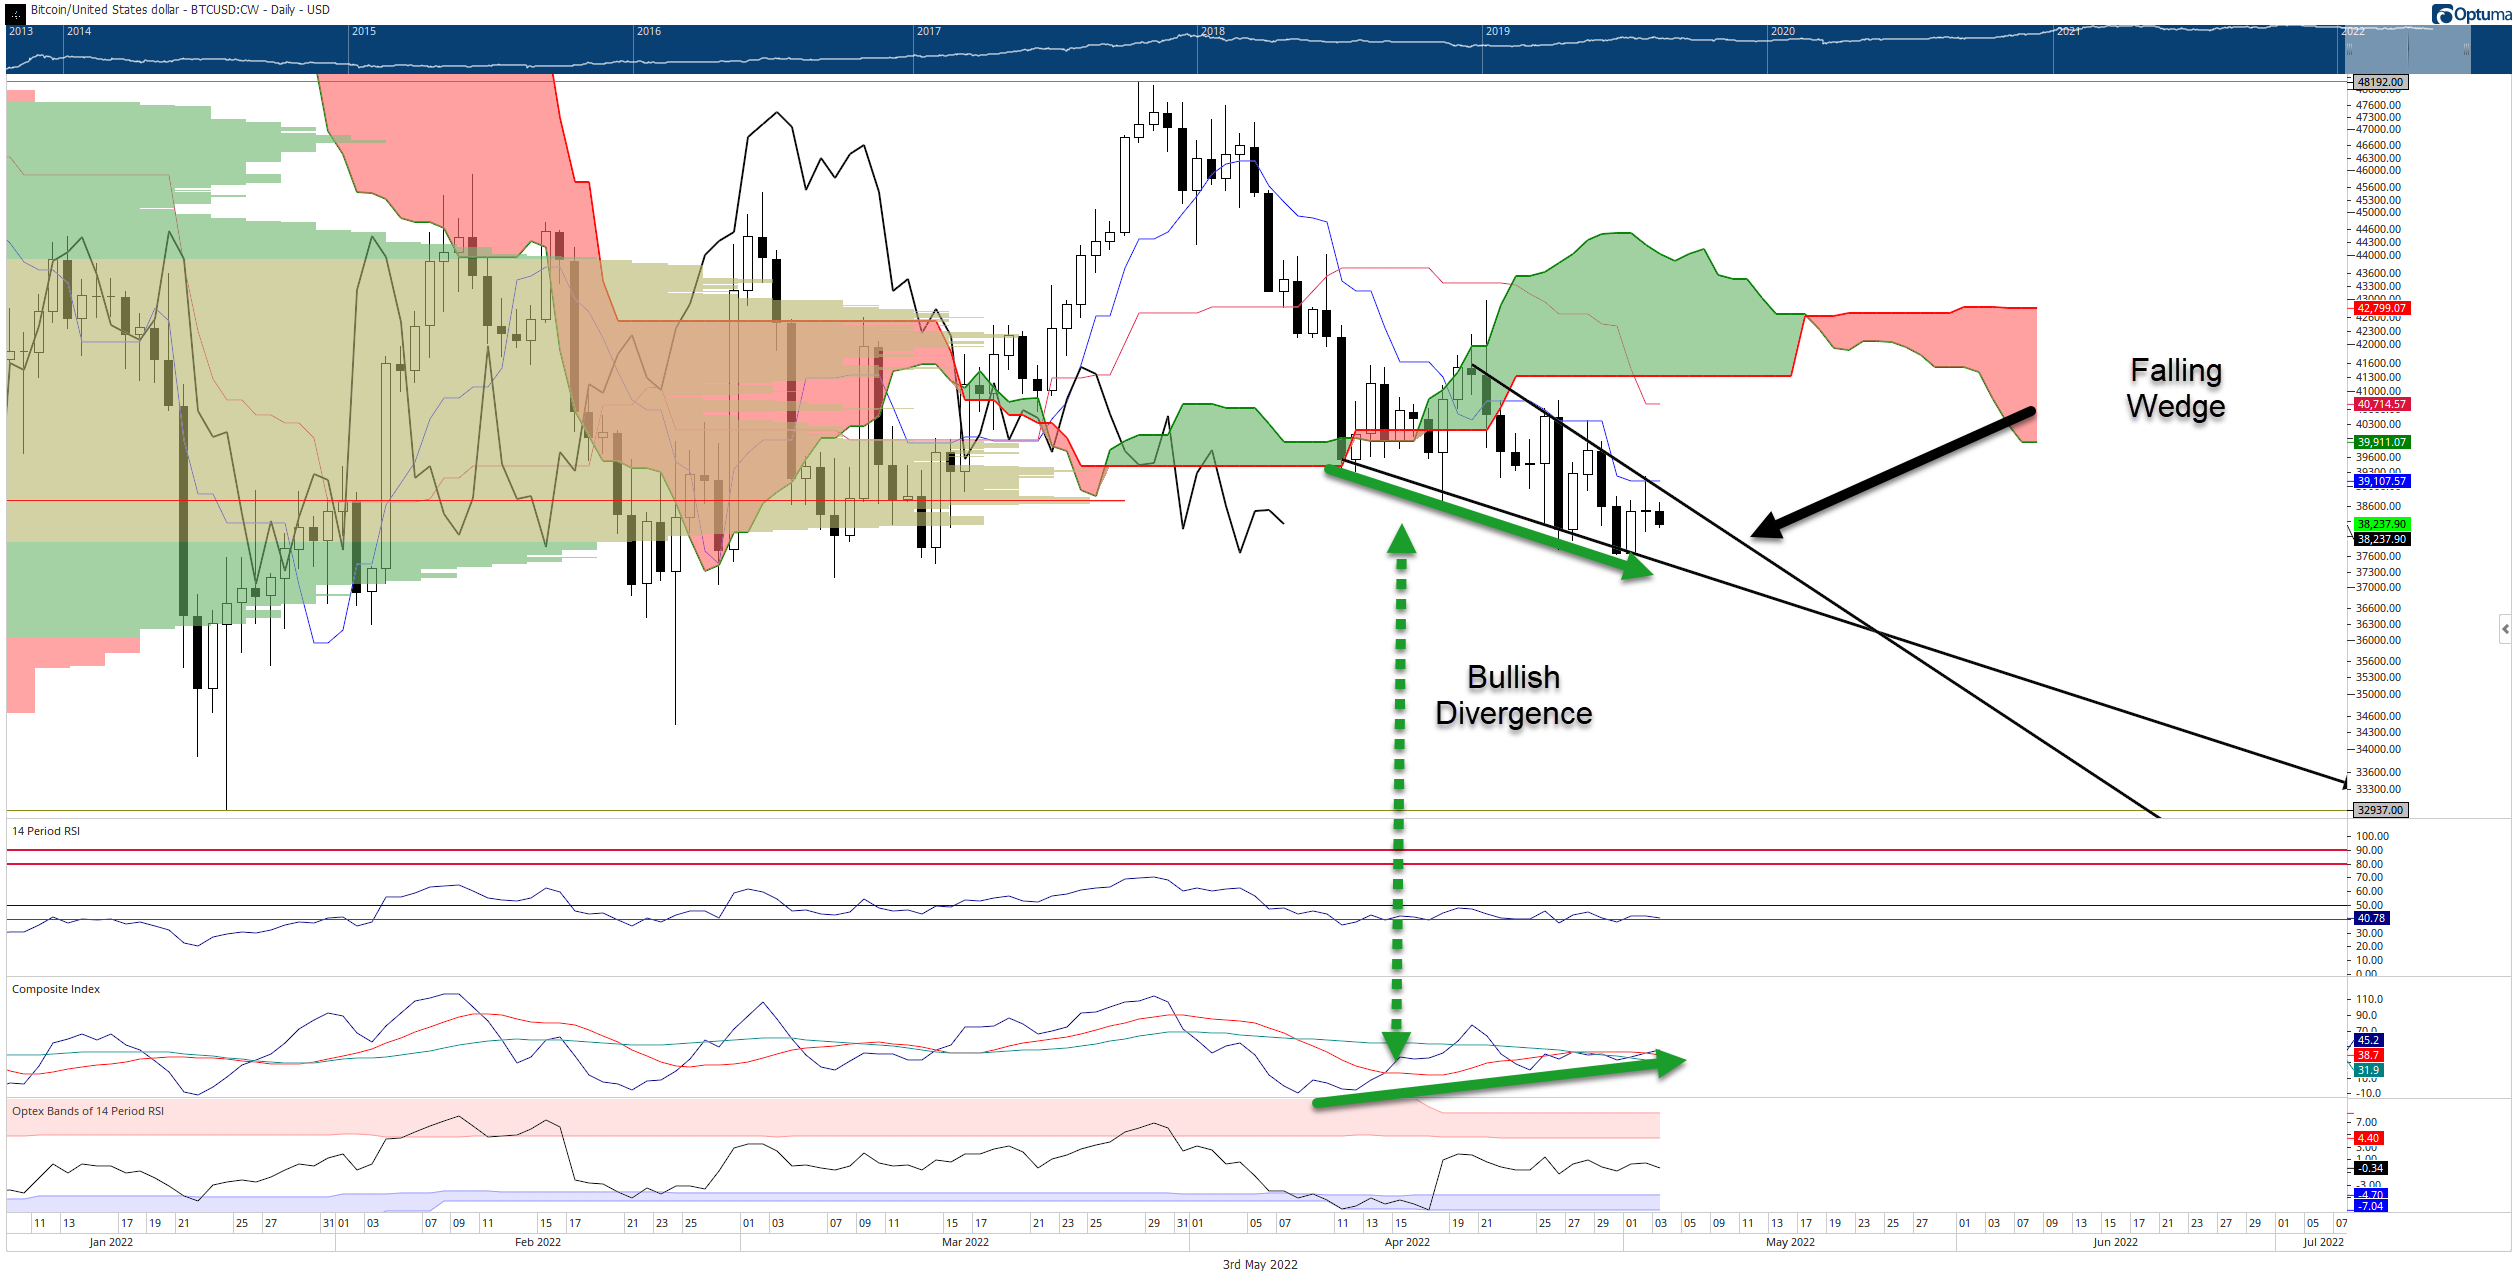
BTC/USD Daily Ichiumoku Kinko Hyo Chart
The second major reversal signal is the bullish divergence between the Composite Index and price action. Bitcoin price has created a series of lower lows, but the Composite Index has formed higher lows. Additionally, the Composite Index has crossed above both its slow and fast-moving averages.
Any recovery for Bitcoin price may be limited to the bottom of the Ichimoku Cloud (Senkou Span B) at $41,300. Any further bullish outlook will likely be invalidated if Bitcoin drops below $36,000.
Ethereum price frustrates bulls and bears, ETH indecisive
Ethereum price action, from an Ichimoku perspective, is in the worst possible place on the daily chart: inside the Ichimoku Cloud. The Ichimoku Cloud represents indecision, volatility, whipsaws, and fakeouts. It is the place where trading accounts go to die. For eleven consecutive weeks, ETH has had contact with the inside of the Cloud.
A clear breakout, bullish or bearish, is needed to establish a future trend. For bears, the path to an Ideal Bearish Ichimoku Breakout is much easier – Ethereum price only needs to close at or below $2,545. From there, ETH may not find support until the 50% Fibonacci retracement at $1,770.
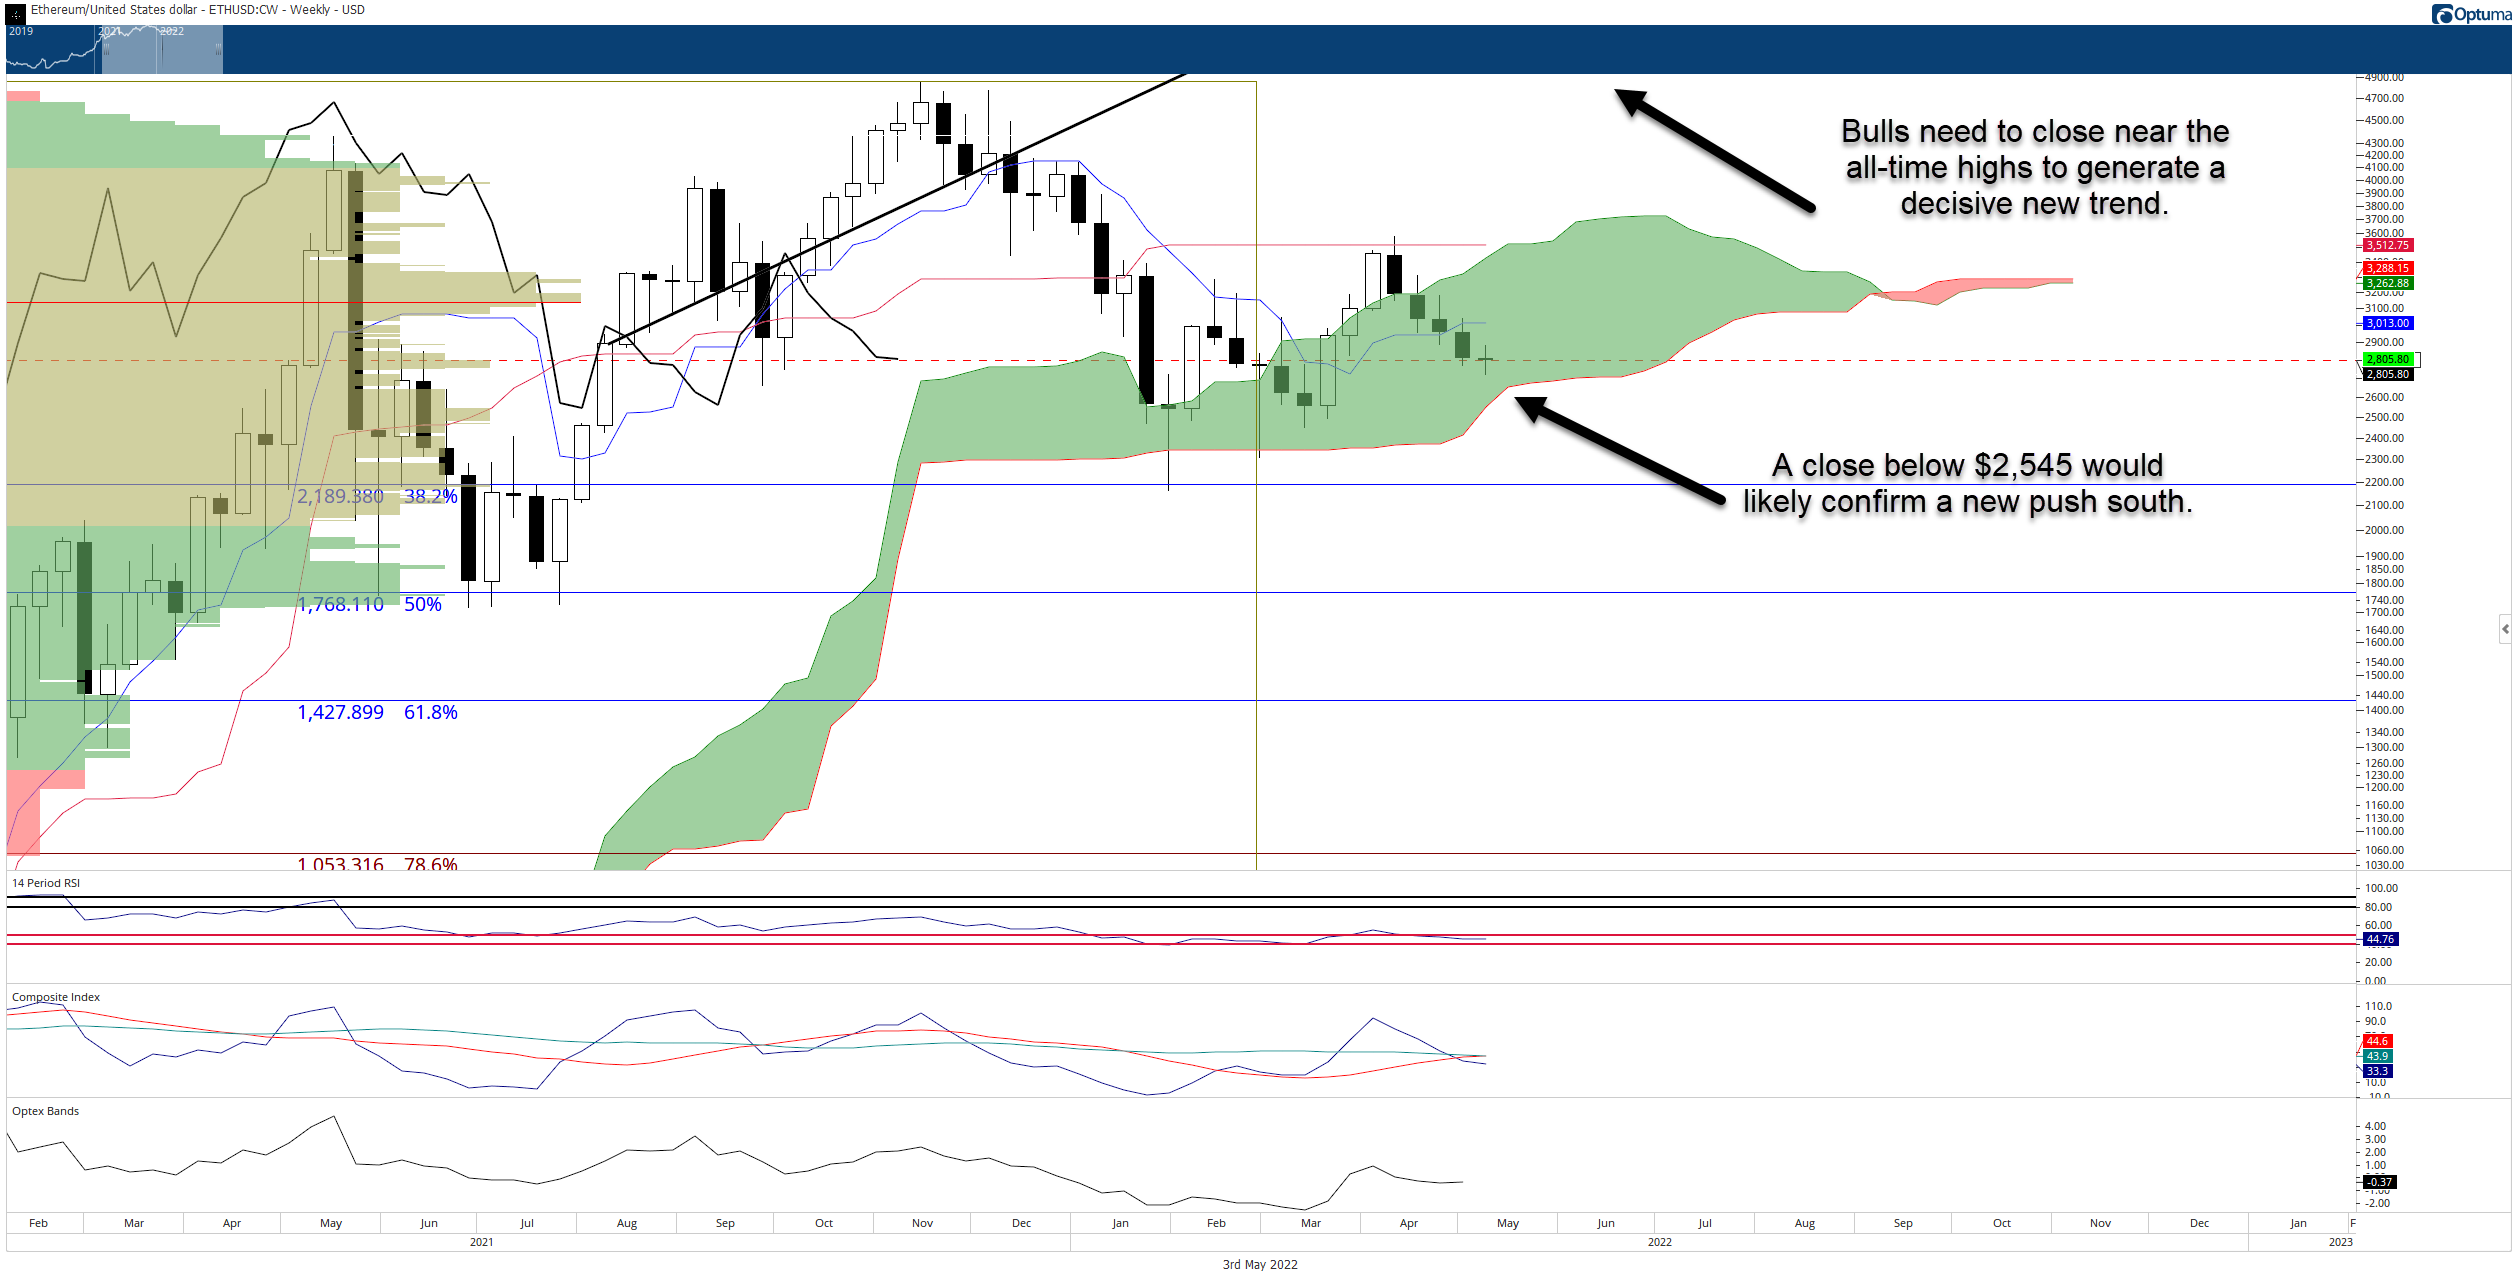
ETH/USD Weekly Ichimoku Kinko Hyo Chart
For bulls to signal a clear and decisive new uptrend, a close above the Ichimoku Cloud – while positive – is not sufficient. To complete an Ideal Bullish Ichimoku Breakout on the weekly chart, Ethereum price must close at or above $4,750 – or just shy of the prior all-time high.
XRP price is at the mercy of the broader market
XRP price continues to underperform its peers and is increasingly at risk of a steeper decline. The current support zone at $0.61 has formed a double-bottom with the prior $0.60 traded range in January 2022. The resulting volume has developed the second-largest high volume node in the 2022 Volume Profile, creating a strong support zone.
If support holds and XRP price is able to push higher, gains may be limited to the $0.80 value area. $0.80 contains the bottom of the daily Ichimoku Cloud (Senkou Span B) and the 2022 Volume Point Of Control. A bounce from the $0.60 level is increasingly likely as the Optex Bands oscillator has hit new all-time lows, indicating an extreme oversold condition.
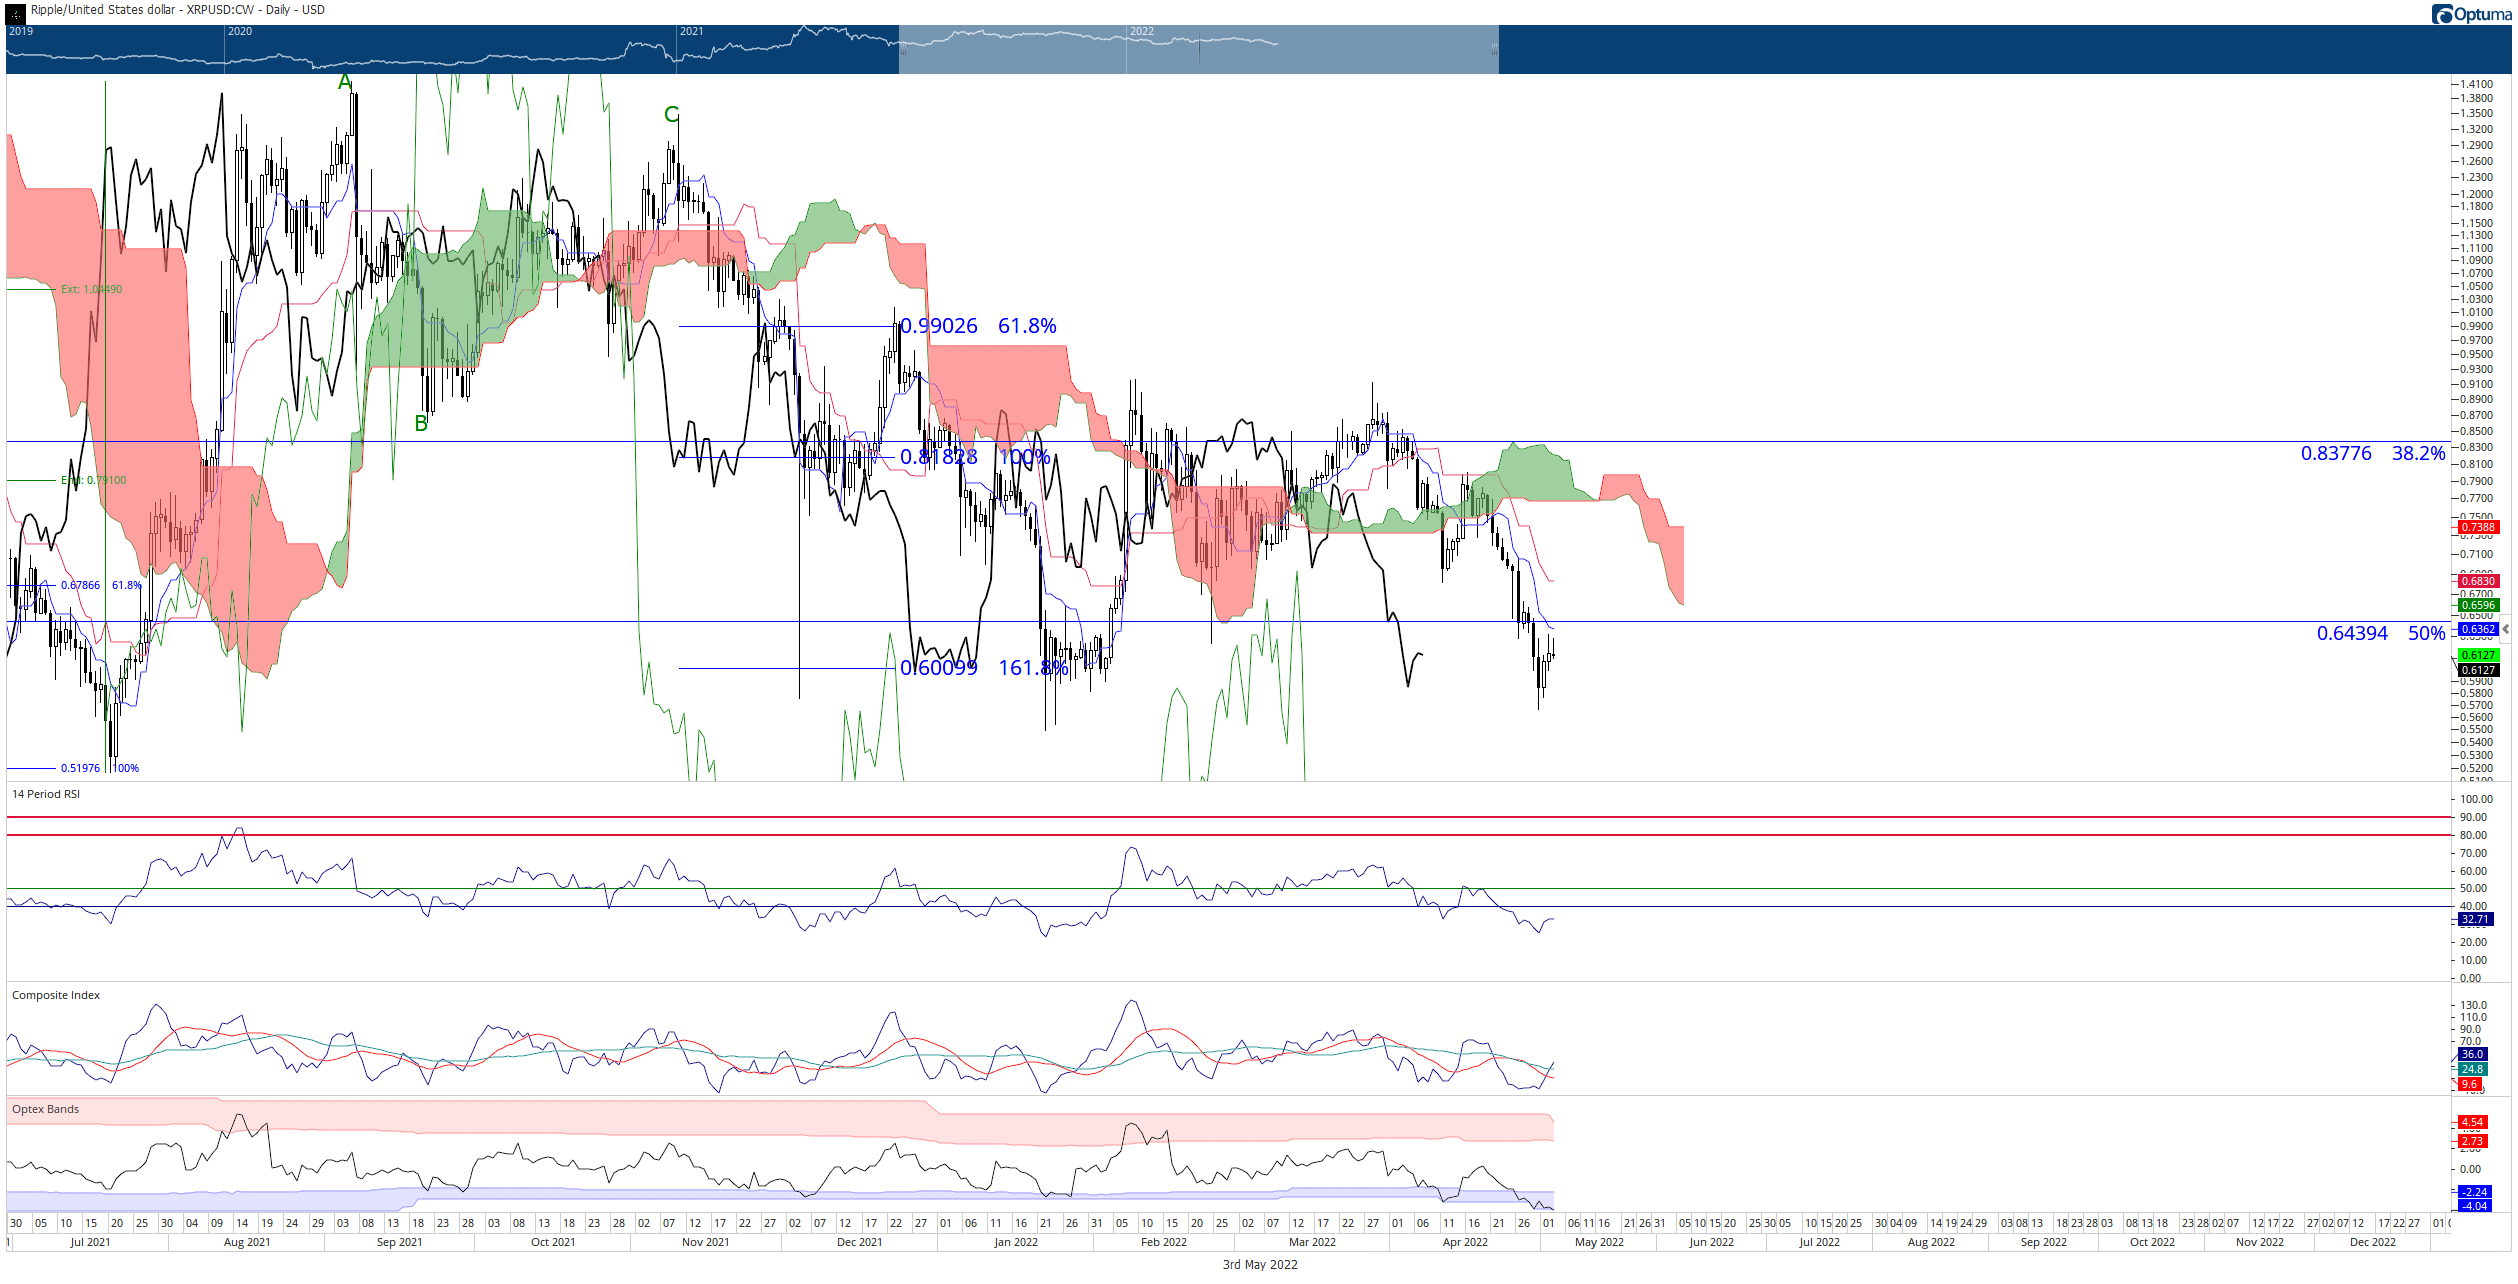
XRP/USD Daily Ichimoku Kinko Hyo Chart
Failure to hold $0.60 could generate a flash crash of XRP price to the 61.8% Fibonacci retracement at the critical $0.50 value area.
Author

Jonathan Morgan
Independent Analyst
Jonathan has been working as an Independent future, forex, and cryptocurrency trader and analyst for 8 years. He also has been writing for the past 5 years.


