Top 3 Price Prediction Bitcoin, Ethereum, XRP: Crypto markets may hit the brakes
- Bitcoin price congestion and indecision continue, but opportunities on both sides develop.
- Ethereum price fails a bullish breakout above its bear flag, threatening continuation moves south.
- XRP price is positioned at a make-or-break point, hovering above final support that could thrust Ripple below $0.80

Bitcoin price remains inside the Cloud within the Ichimoku Kinko Hyo system, indicating continued volatility and uncertainty. Ethereum price failed to close above the bear flag on Tuesday, but the bullish structure remains. XRP price barely holding support, could drop lower.
Bitcoin price develops opportunities on its Point and Figure charts
Bitcoin price remains stuck inside the Cloud on the daily Ichimoku chart, providing little opportunity or guidance when viewed from that chart style. However, Point and Figure charting reduces the ‘noise’ associated with Japanese candlestick charts and focuses only on price action, giving a clearer picture of Bitcoin’s behavior and what kind of trading opportunities exist.
A theoretical long trade setup exists with a buy stop order at $60,000, a stop loss at $58,000, and a profit target at $66,000. This hypothetical entry is exceptionally bullish for two reasons. First, the entry is a breakout above a triple-top, and second, the entry confirms a powerful bullish reversal pattern in Point and Figure known as a Bearish Fakeout.
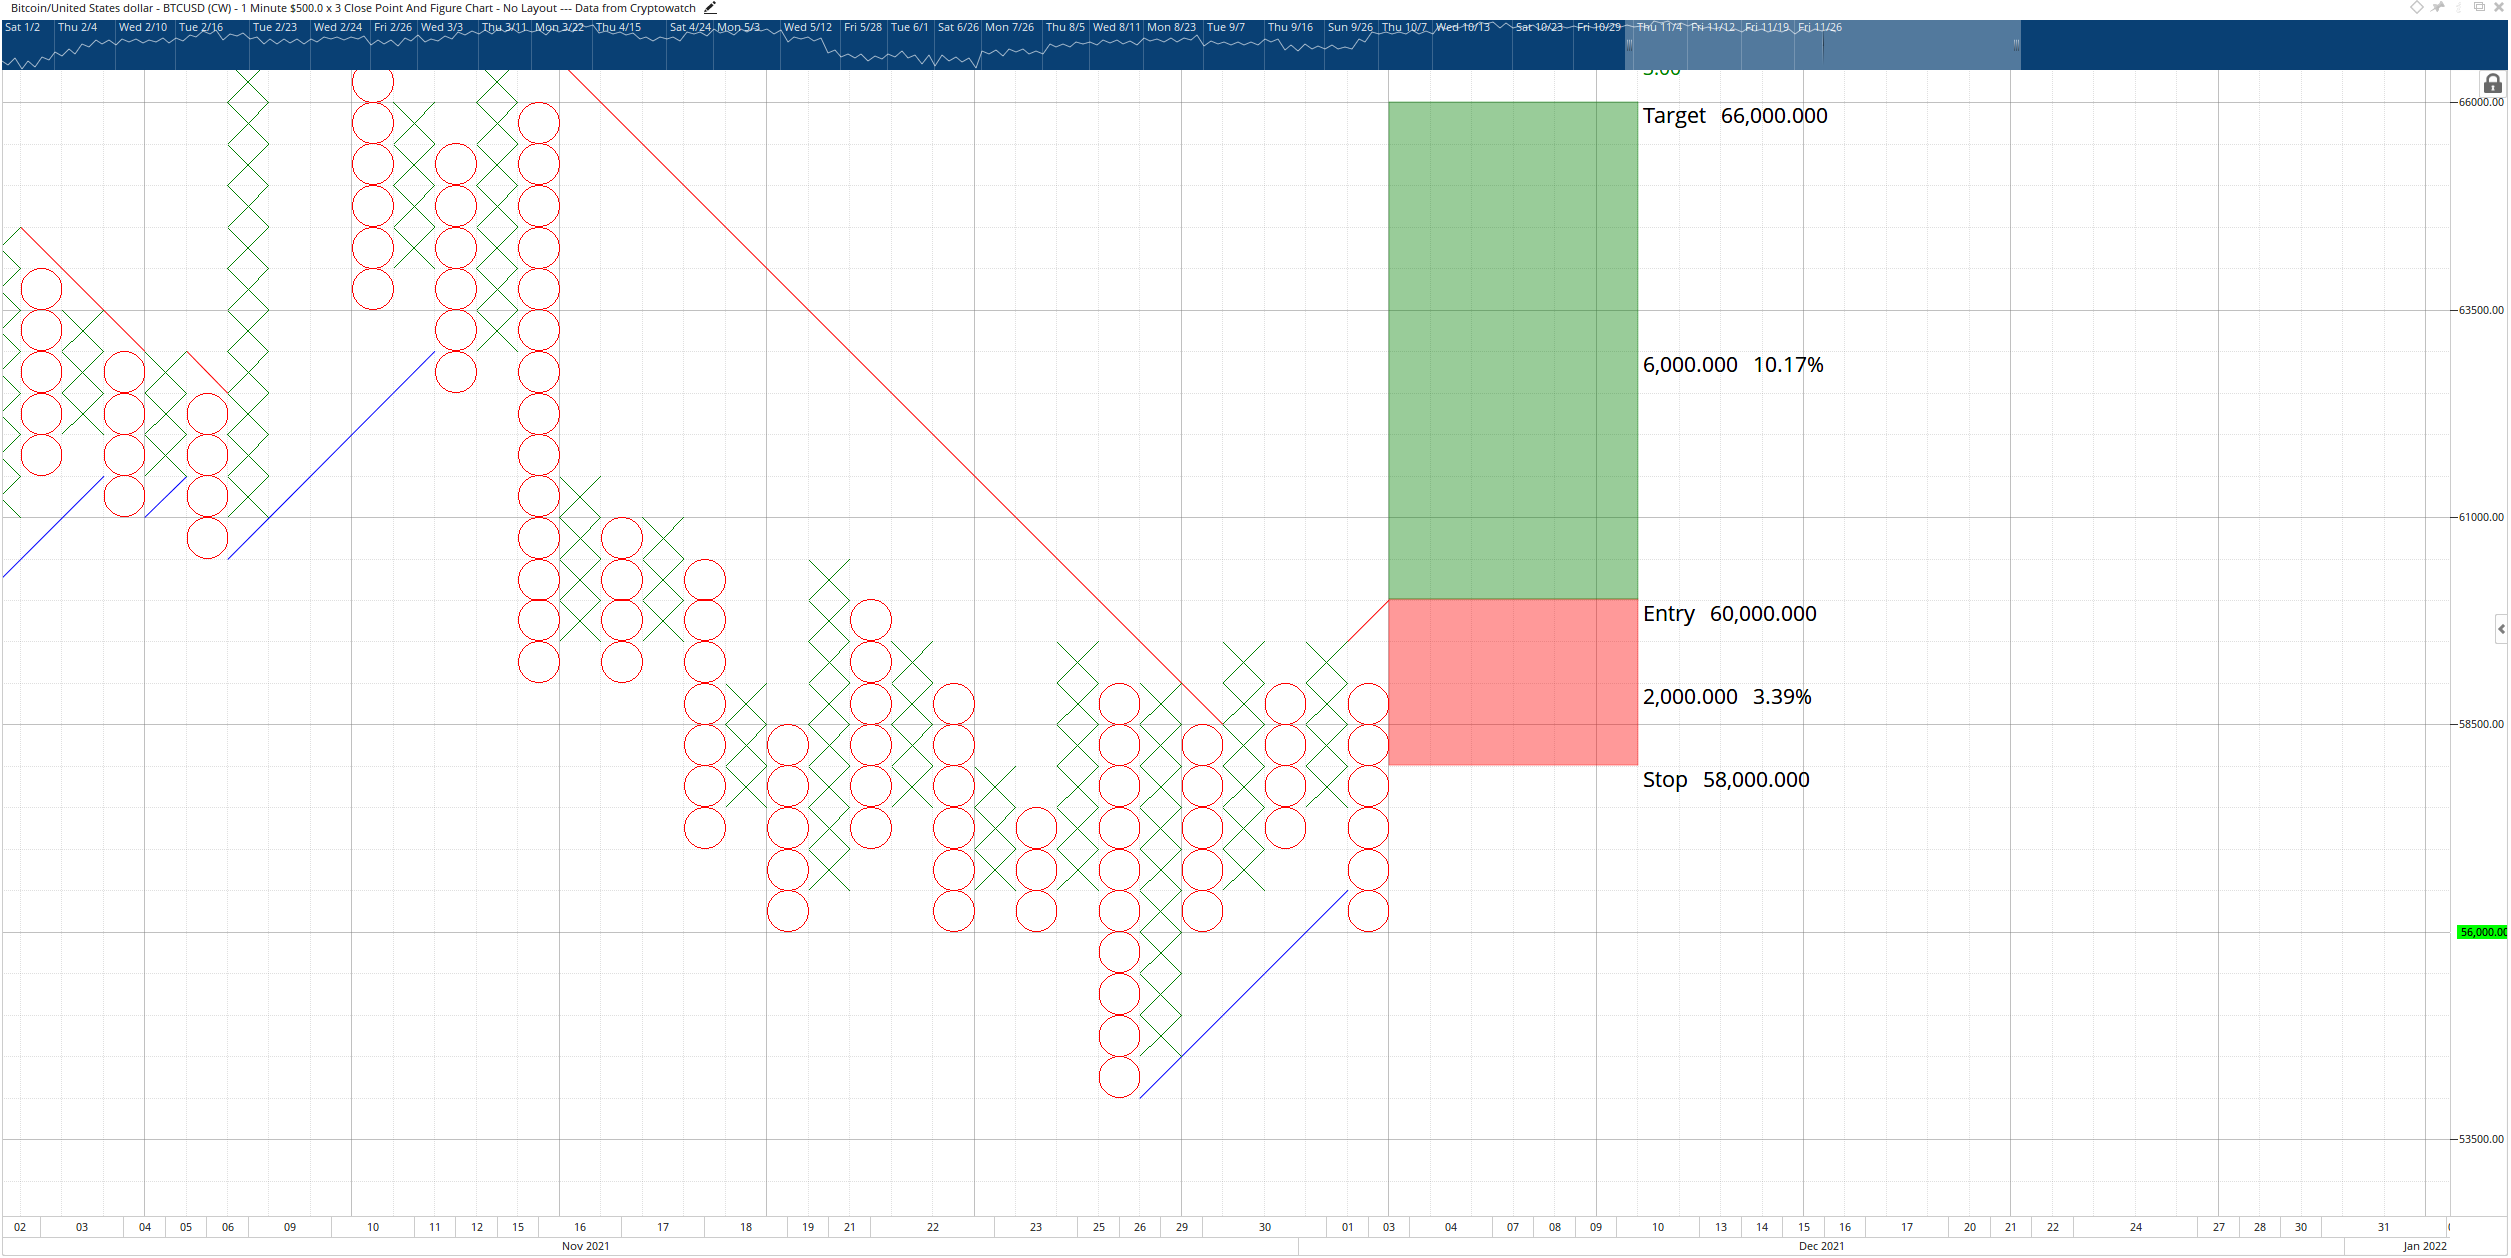
BTC/USD $500/3-box Reversal Point and Figure Chart
The theoretical long idea is invalidated if the current O-column moves below $55,000.
On the short side of the trade, a hypothetical short idea is a sell stop order at $53,000, a stop loss at $56,000 and a profit target at $44,000. The entry confirms one of the most sought-after short entry patterns in Point and Figure, a Bearish Catapult. In addition, a trailing stop of one to two boxes to protect any implied profits would help mitigate any whipsaws in price action that may occur.
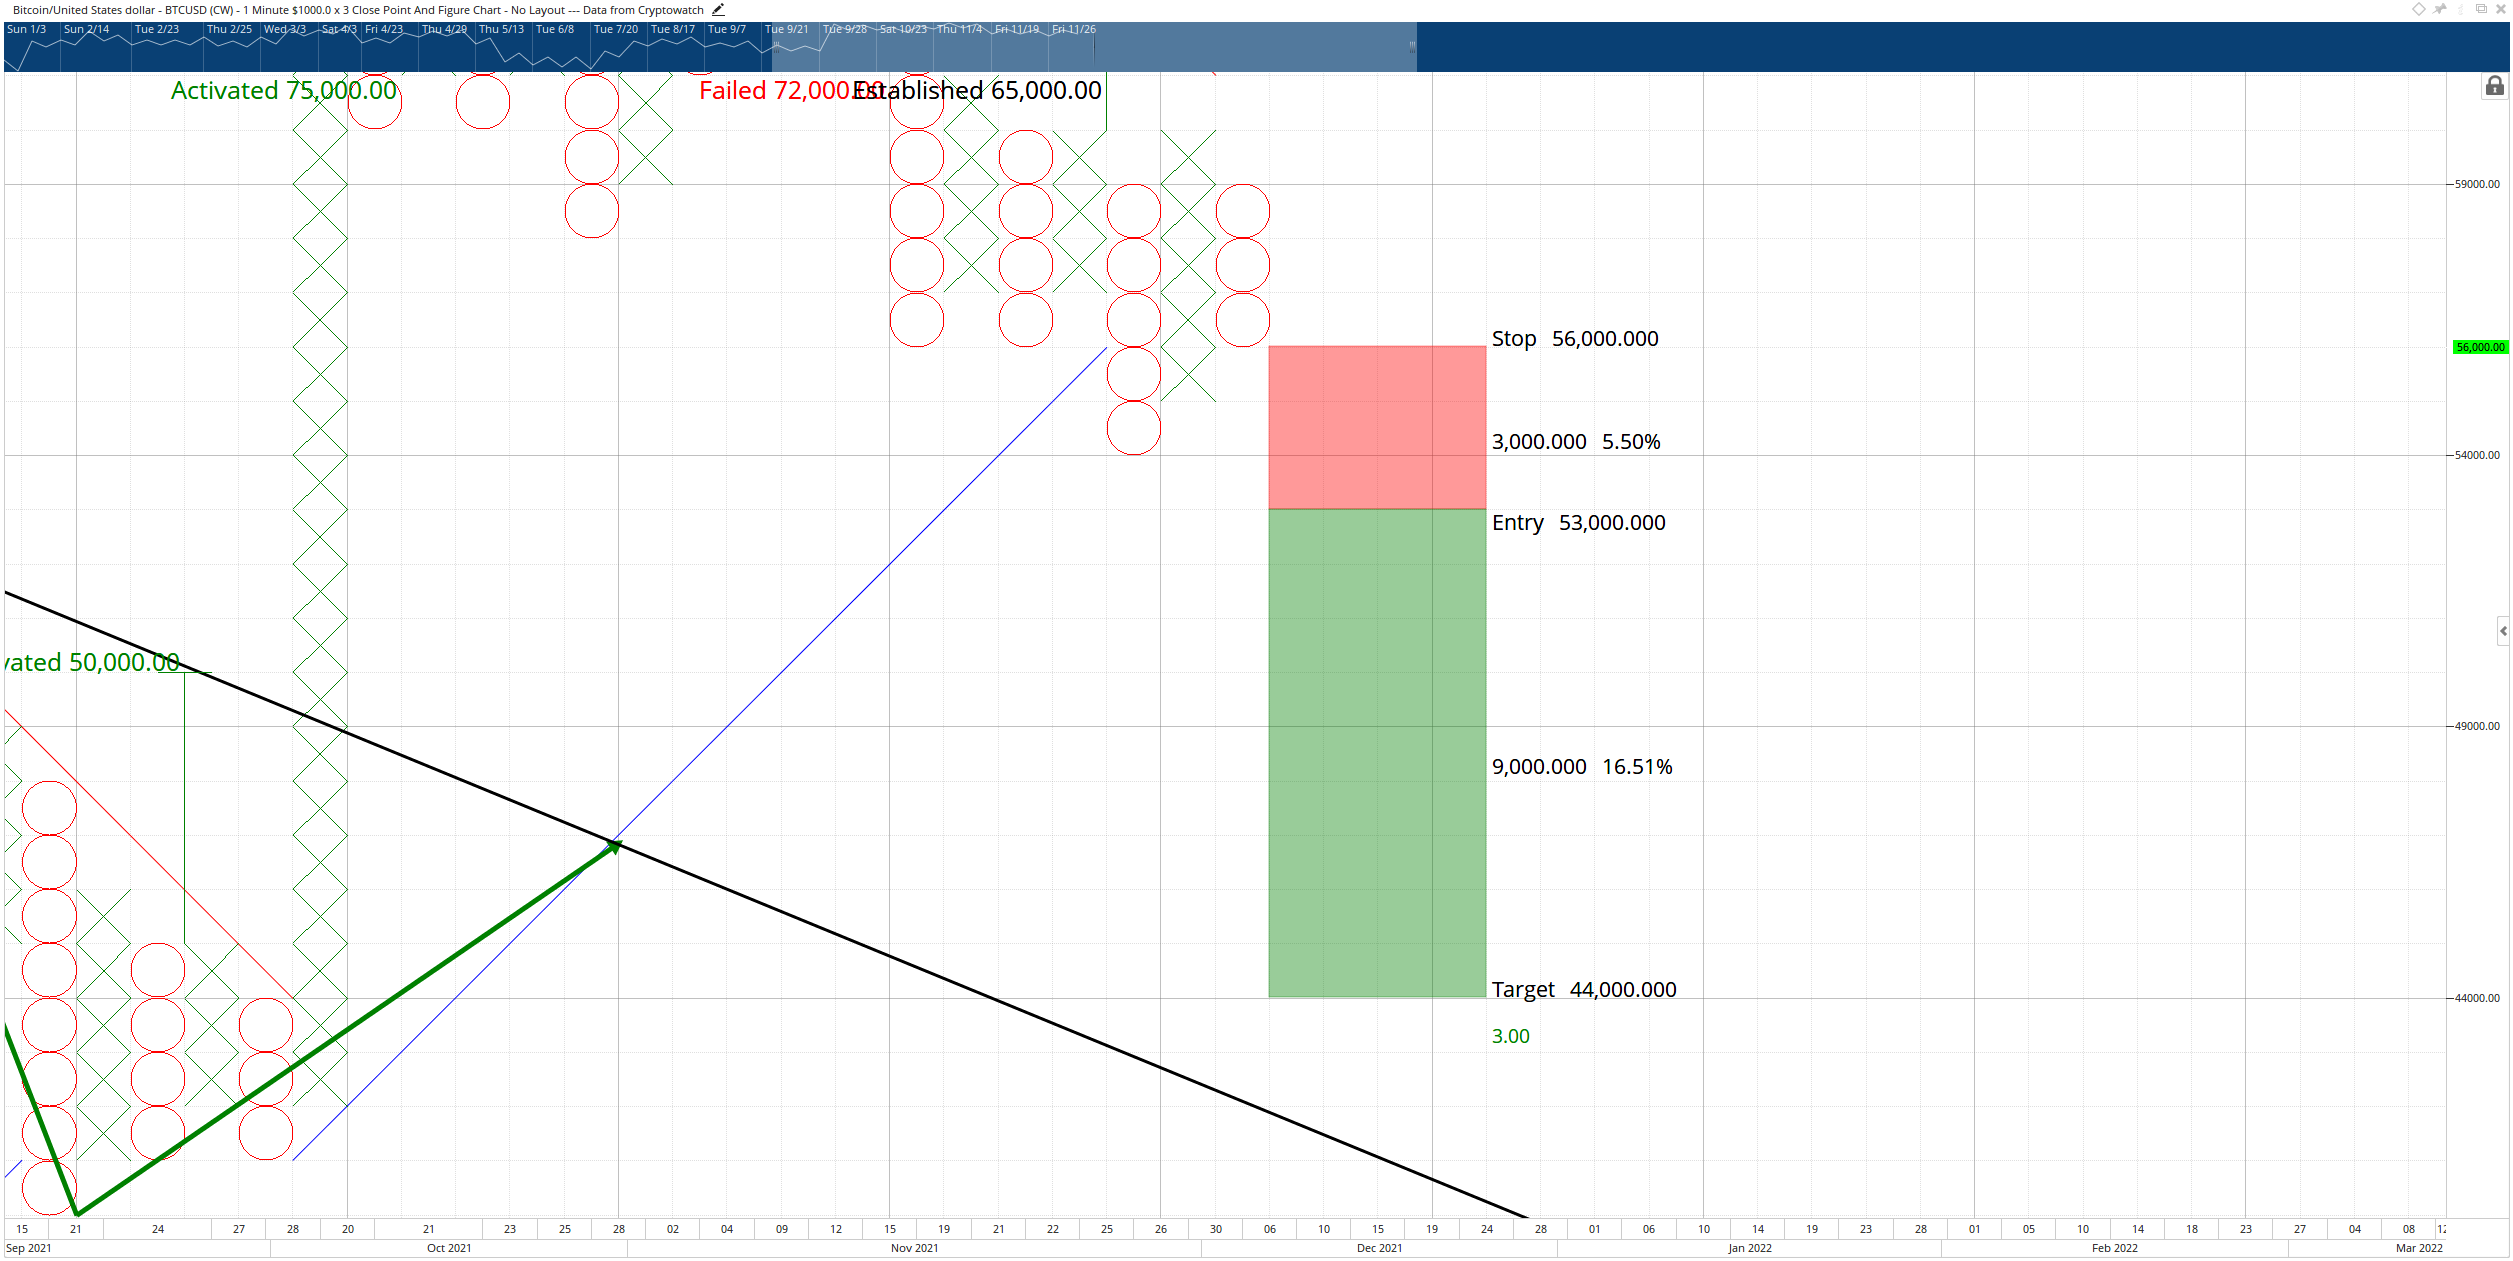
BTC/USD $1,000/3-box Reversal Point and Figure Chart
The hypothetical short setup is invalidated if the long idea above is triggered.
Ethereum price drops back inside bear flag
Ethereum price action, at first glance, appears bearish because it has returned inside the bear flag it has been trading in since November 17th. However, Etheruem’s $50/3-box Reversal Point and Figure chart reveals a probable bullish setup that could launch Ethereum to new all-time highs. The possible long setup is a buy stop order at $4,850, a stop loss at $4,600, and a profit target at $6,250.
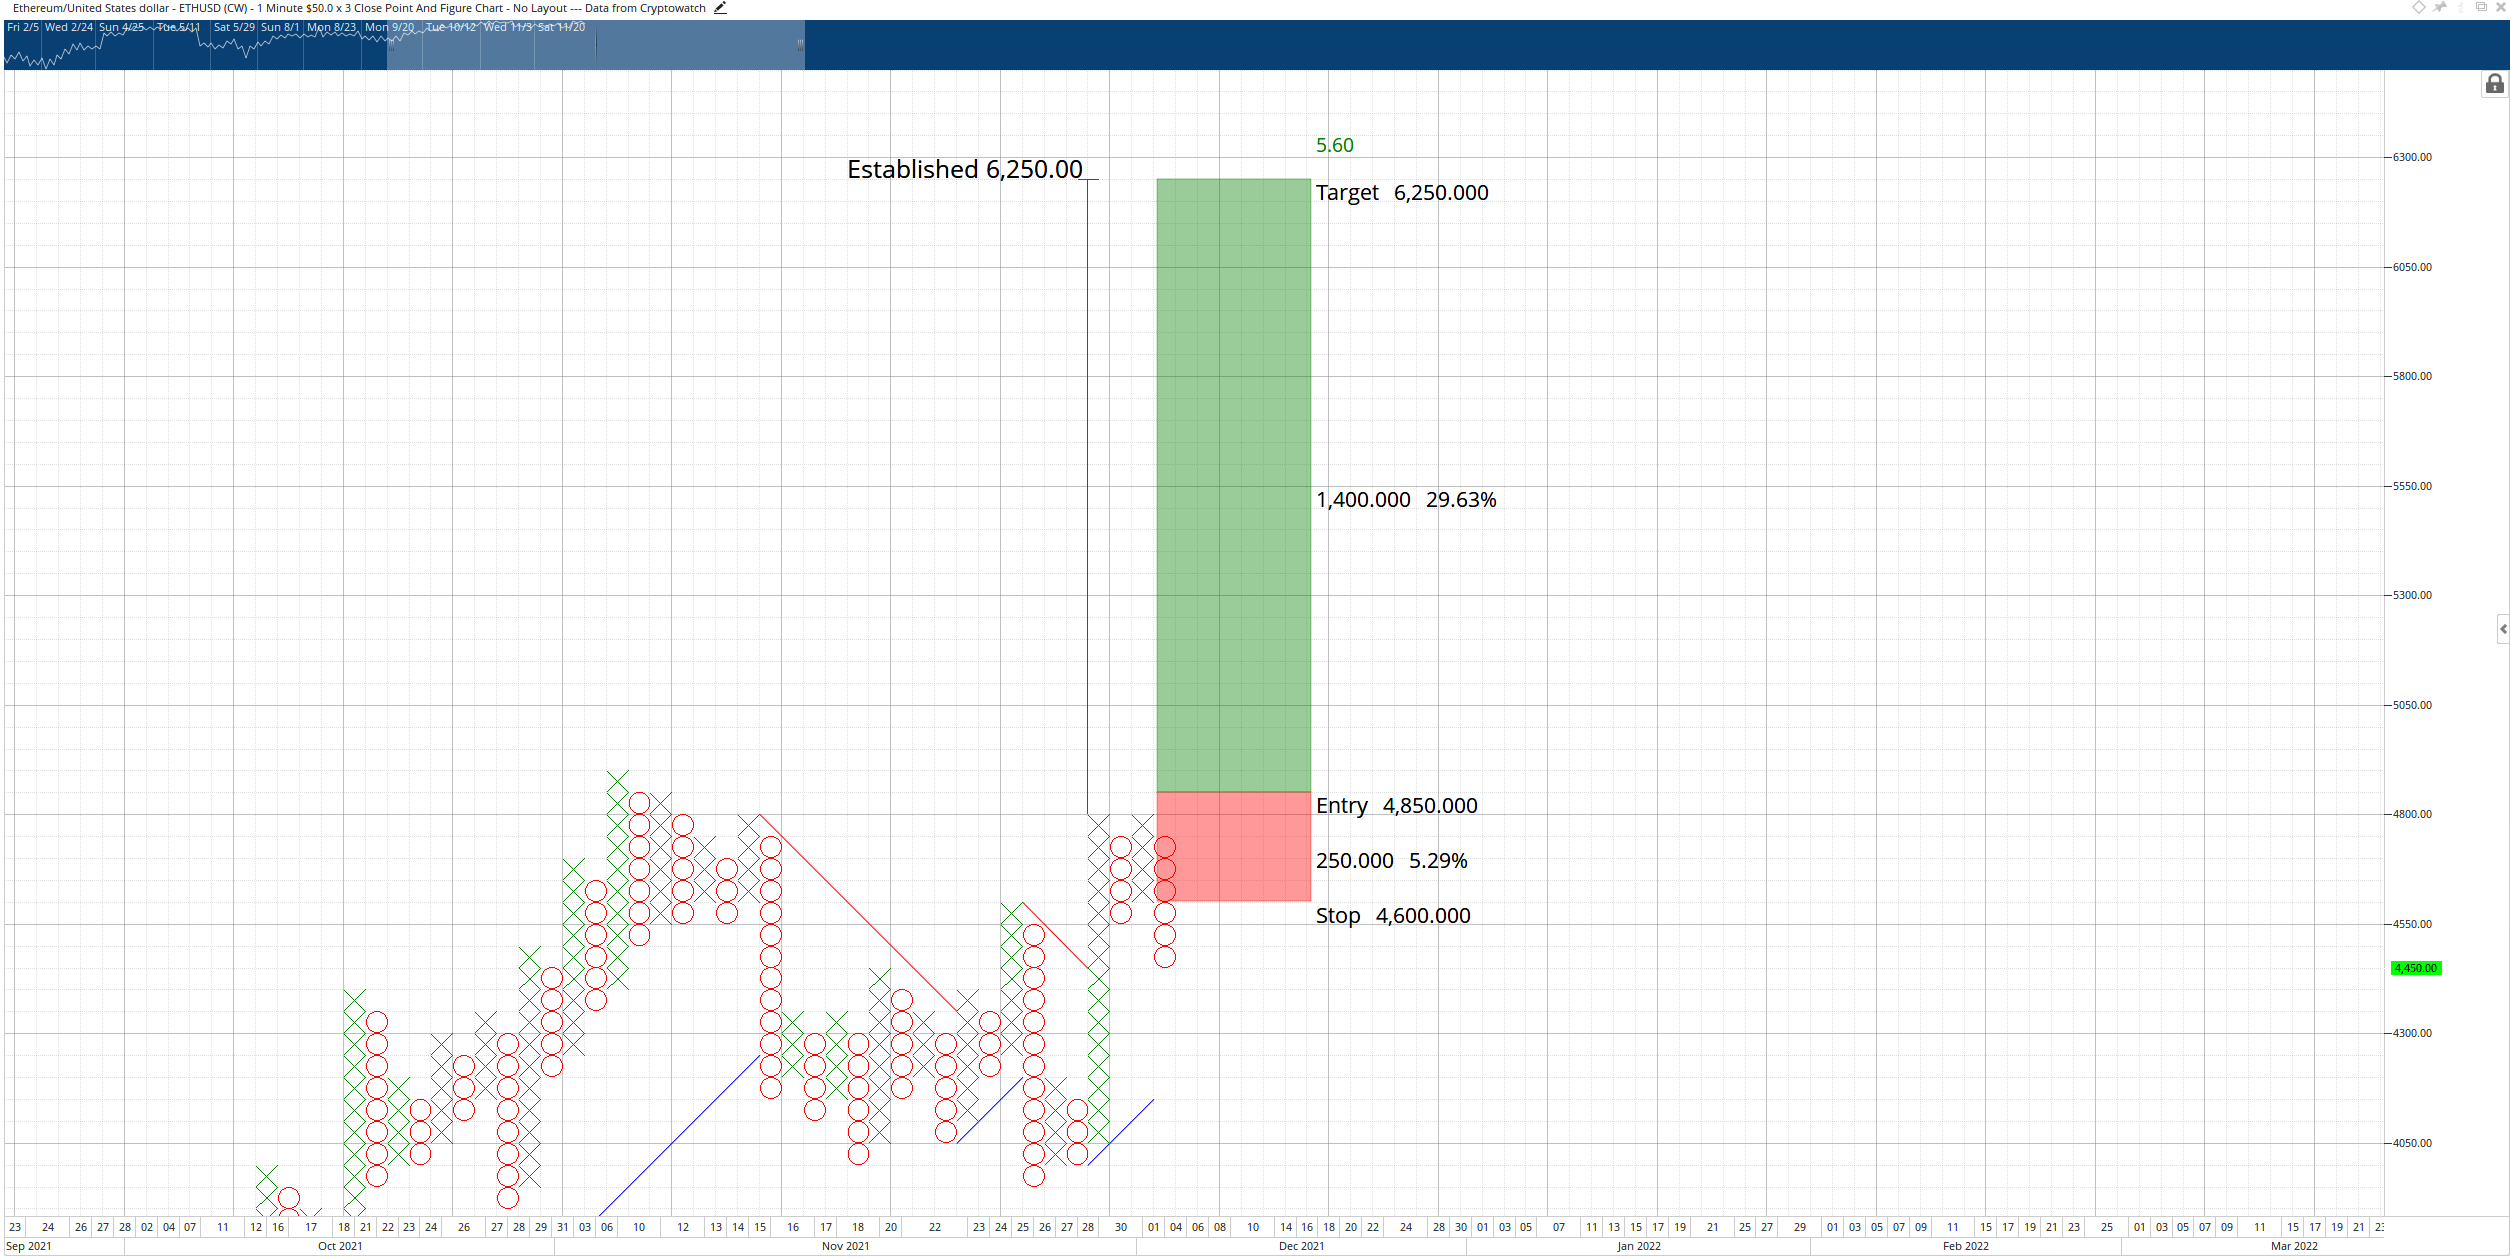
ETH/USD $50/3-box Reversal Point and Figure Chart
The possible long entry is invalidated if Ethereum price moves the current O-column below the $4,200 value area.
XRP price on a knife’s edge, warning of a broad collapse if bulls fail to hold support
XRP price is currently facing the most critical support level for the remainder of 2021. On the weekly chart, XRP is currently below the Cloud and the Tenkan-Sen and is just barely holding above the final Ichimoku support level – the Kijun-Sen ($0.96). Likewise, the Chikou Span is struggling to remain above the body of the candlestick it is at. If XRP closes the weekly candlestick below $0.89, it would put the Chikou Span below the body of the candlesticks and the close below the Kijun-Sen, likely triggering a sell-off to the $.80 value area.
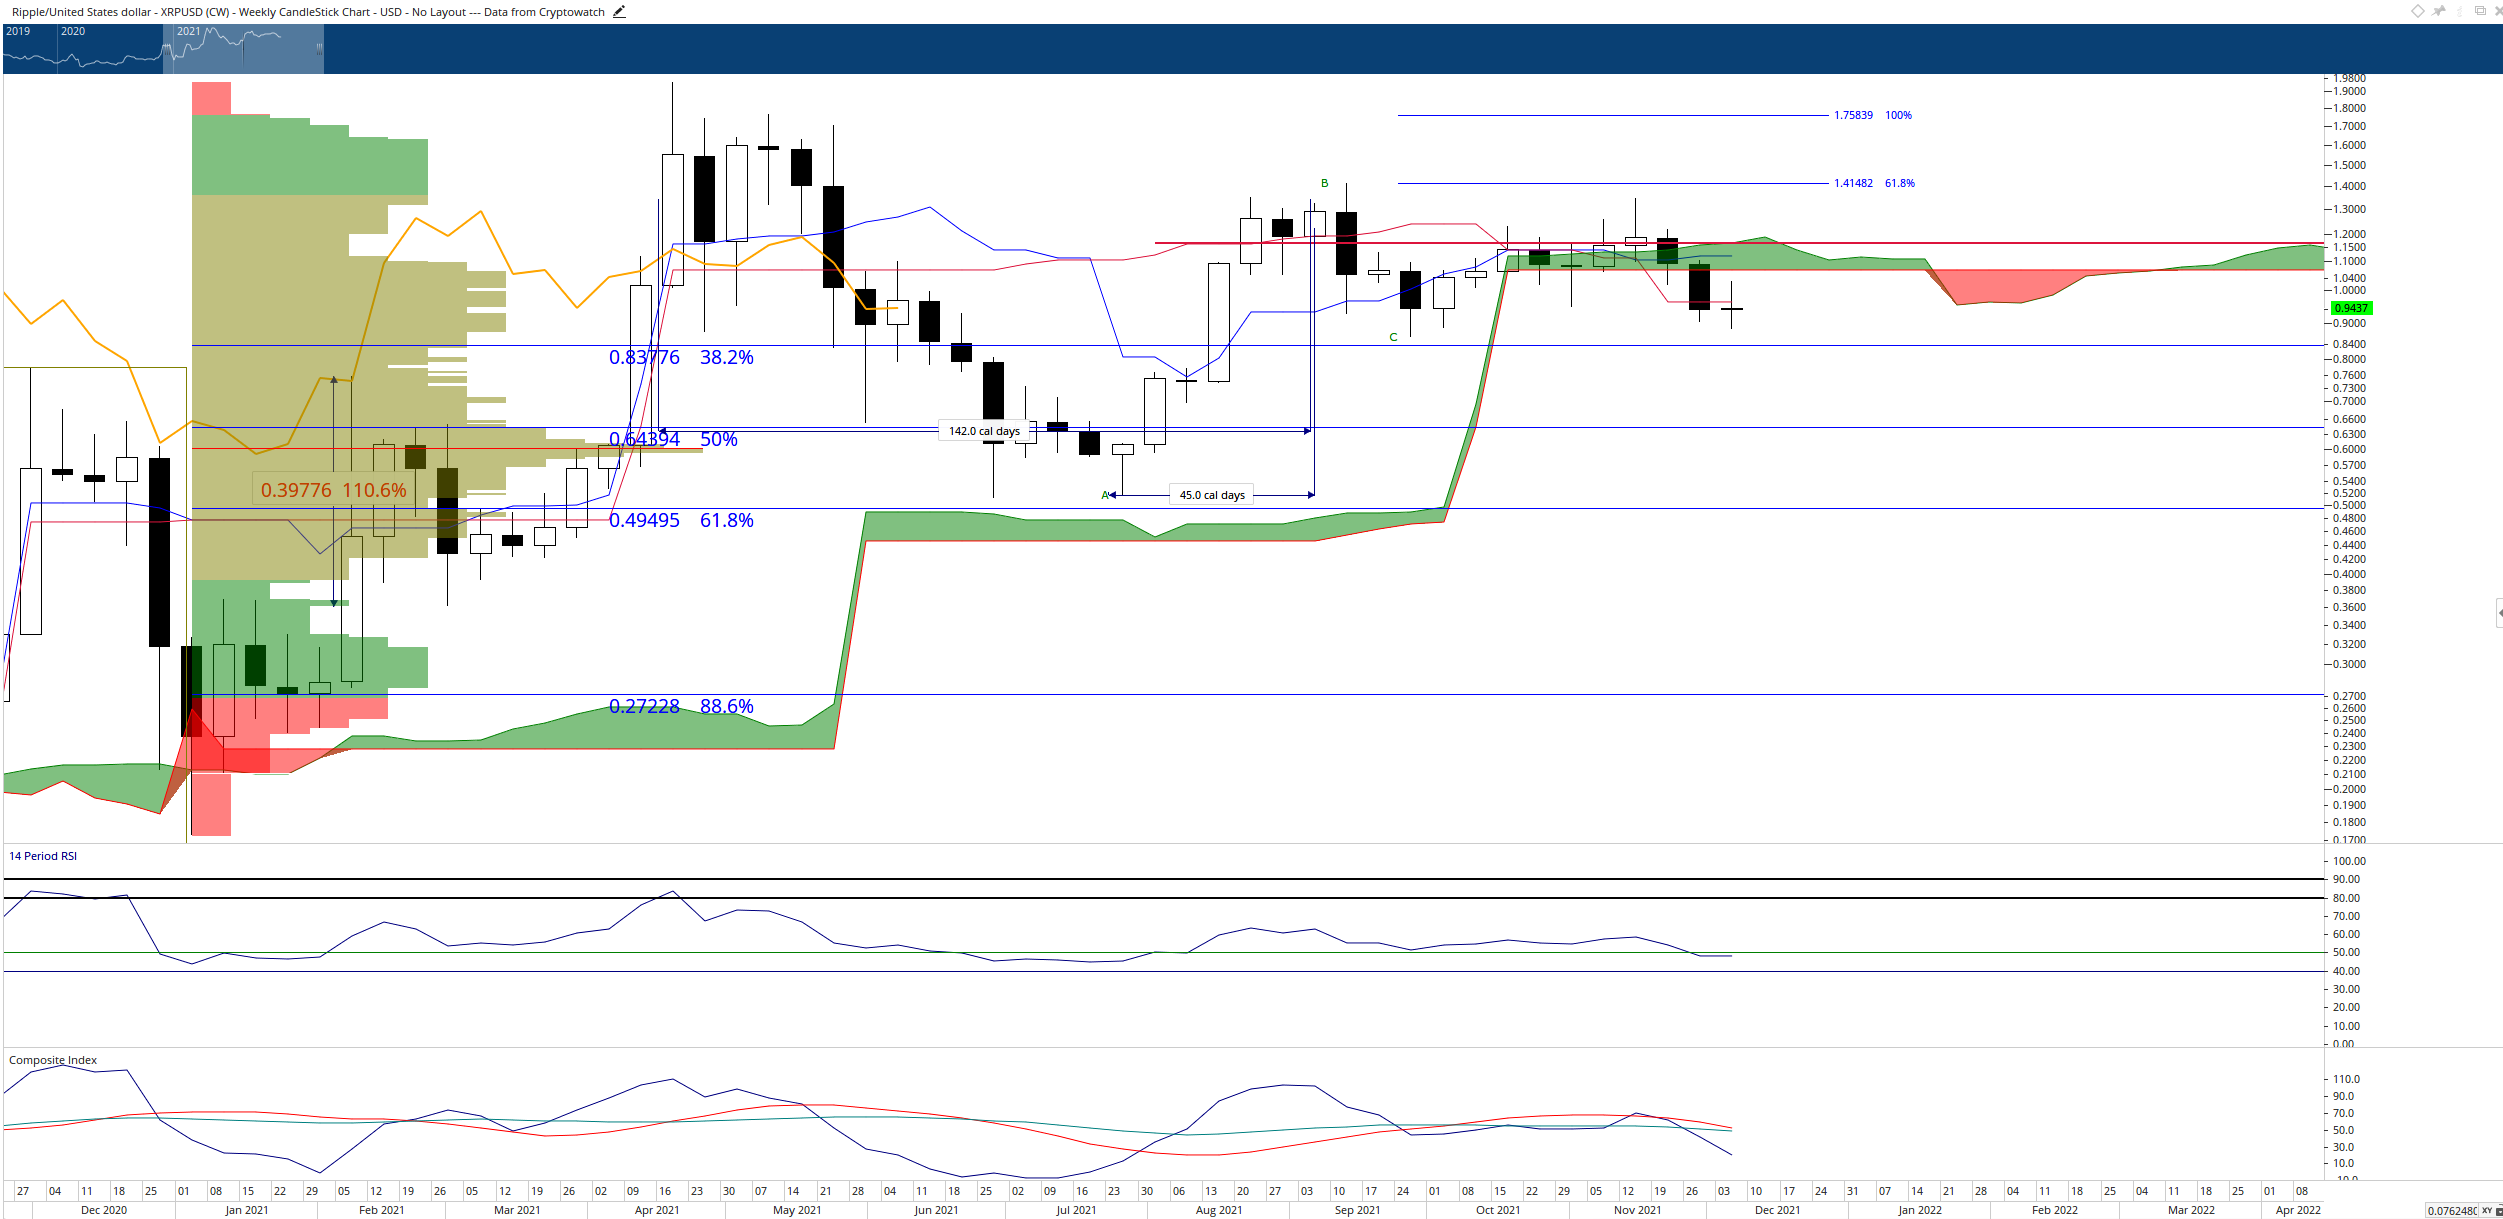
XRP/USDT Weekly Ichimoku Chart
However, if XRP bulls can hold XRP above the Kijun-Sen and close the weekly chart with the Chikou Span above the body of the candlesticks, then momentum could quickly change in favor of the buyers. As a result, a bear trap would likely form, and that momentum could generate the pressure necessary to push XRP to a close above $1.17. If that occurs, XRP will convert into a full-blown bull market, beginning a new push towards the $2.00 and $3.00 value areas.
Author

Jonathan Morgan
Independent Analyst
Jonathan has been working as an Independent future, forex, and cryptocurrency trader and analyst for 8 years. He also has been writing for the past 5 years.


