Top 3 Price Prediction Bitcoin, Ethereum, Ripple: Whale Watching 101 – Guppies vs Goldfish
- Bitcoin price shows a significant uptick in volume while trading below the 200-week moving average.
- Ethereum price hovers above the 200-week moving average but shows bearish on-chain metrics.
- Ripple price on-chain metrics could form the sell signal that high-cap investors are looking for.

A common rule amongst fishermen is that guppies and goldfish can never mix.
This article utilizes on-chain metrics to gain perspective on the current cryptocurrency market. Although market sentiment and the technicals hint at bullish potential, the on-chain metrics are beginning to paint an entirely different narrative.
Bitcoin price has a decision to make
Bitcoin price currently auctions at $19,743 as the Volume Profile Indicator shows a significant uptick in transactions while BTC price remains stagnant. The mundane market movement comes after Bitcoin lost 20% of its market value last month.
The bears successfully breached the 200-week moving average (WMA) and caused bulls to jump ship near the psychological $20,000 level. The breach has enticed retail traders to join the bears calling for the liquidation of summertime's lowest Bitcoin price at $17,622.
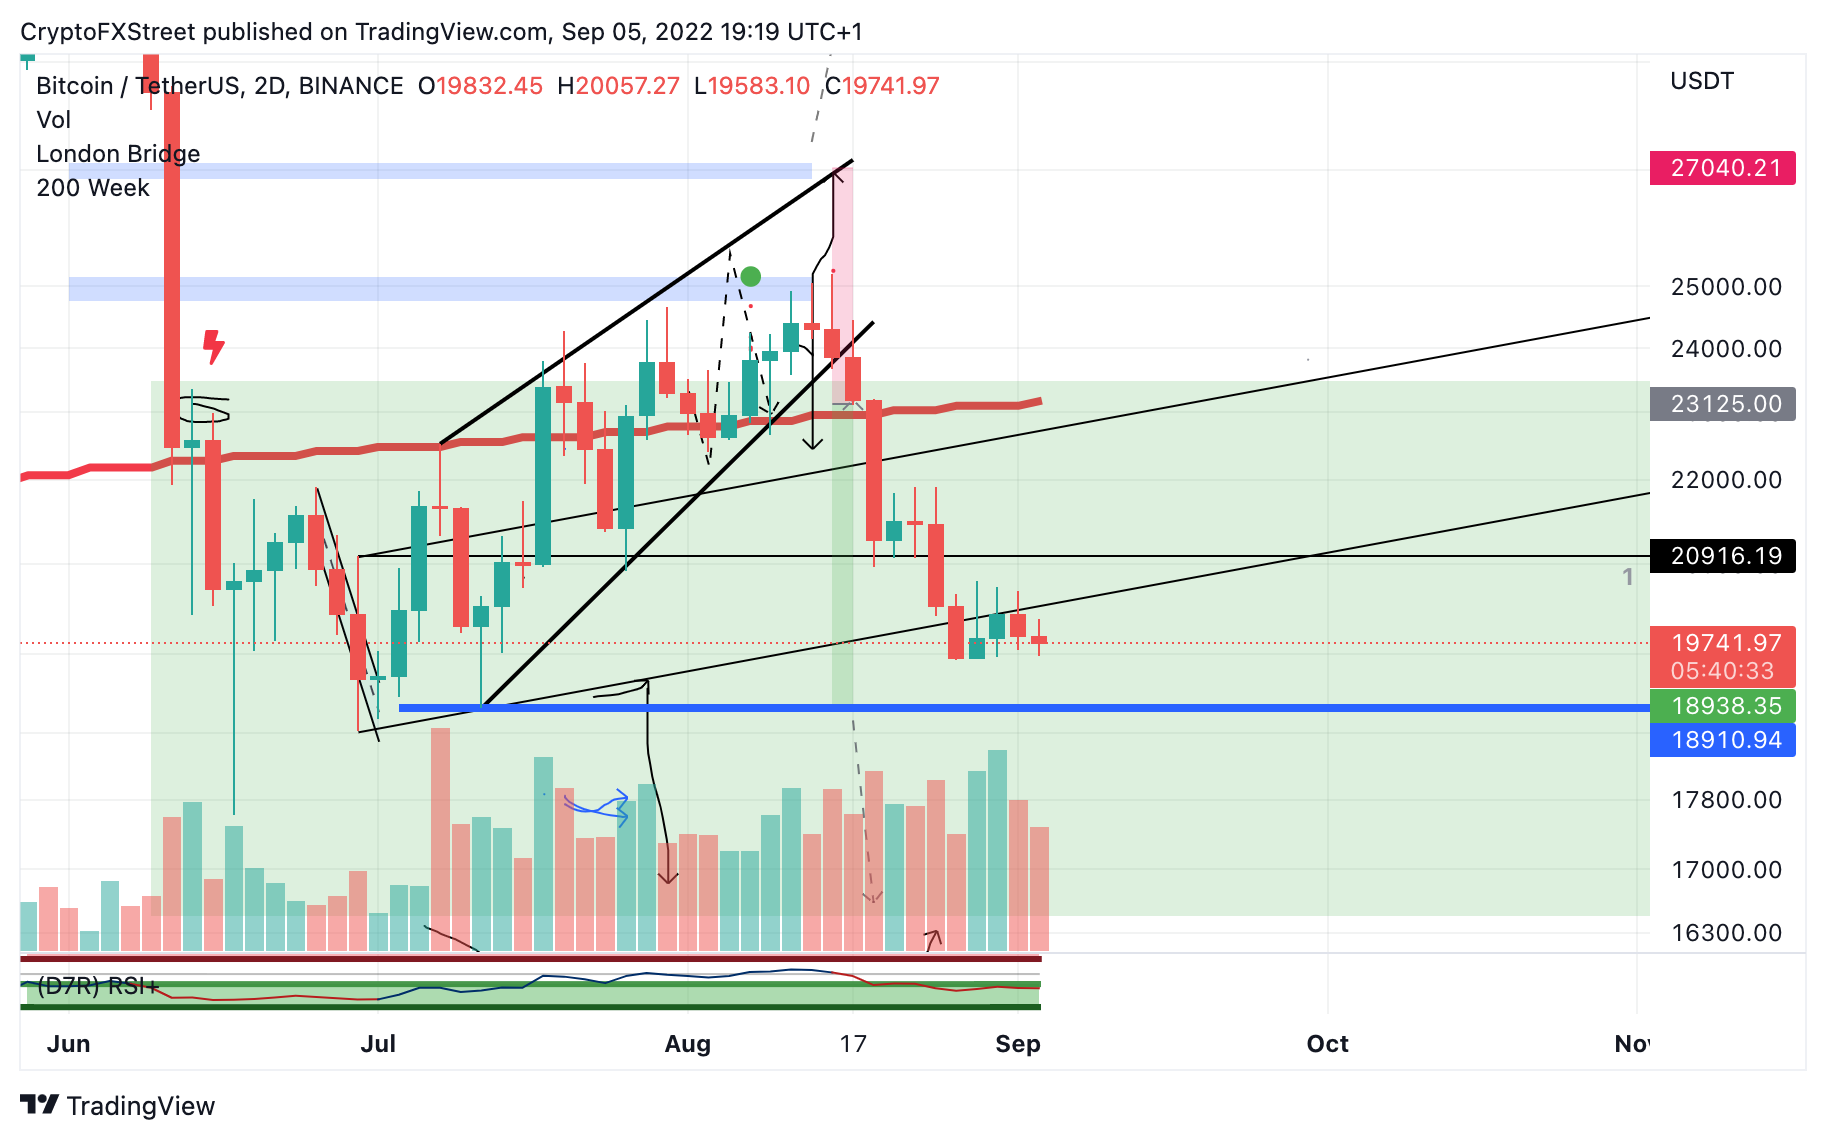
BTC.USDT 2-Day Chart
On-Chain Metrics
Underneath the hood, the Bitcoin price shows a confounding piece of evidence for day trading bears. CryptoQuant's Bitcoin Miners' Position Index shows a significant uptick in the miners' deposits to exchanges. On September 1, the indicator was nearly 10x compared to its average fluctuating range.
-637979972367530427.png)
CryptoQuants’ Bitcoin Miners' Position Index
According to the Cryptoquant
"Higher value shows that miners are sending more coins than usual which indicates possible selling. If miners send some proportion of their reserve at the same time, it could trigger a price drop."
Combining these factors, the Bitcoin price could set up a bloody September. Invalidation of the bearish thesis can occur if the bulls can reconquer the 200-WMA on a higher time frame chart such as the weekly/monthly. The 200 WMA is currently 17% above the Bitcoin price.
In the following video, our analysts deep dive into the price action of Bitcoin, analyzing key levels of interest in the market. -FXStreet Team
Ethereum price paints a different picture
Ethereum price trades at $1,566 as the decentralized smart contract token hovers above the 200-WMA. As market sentiment blooms in the positive amongst the upcoming Merge, the Ethereum price shows a concerning signal underneath the hood that antagonizes the bullish long-term perspective.
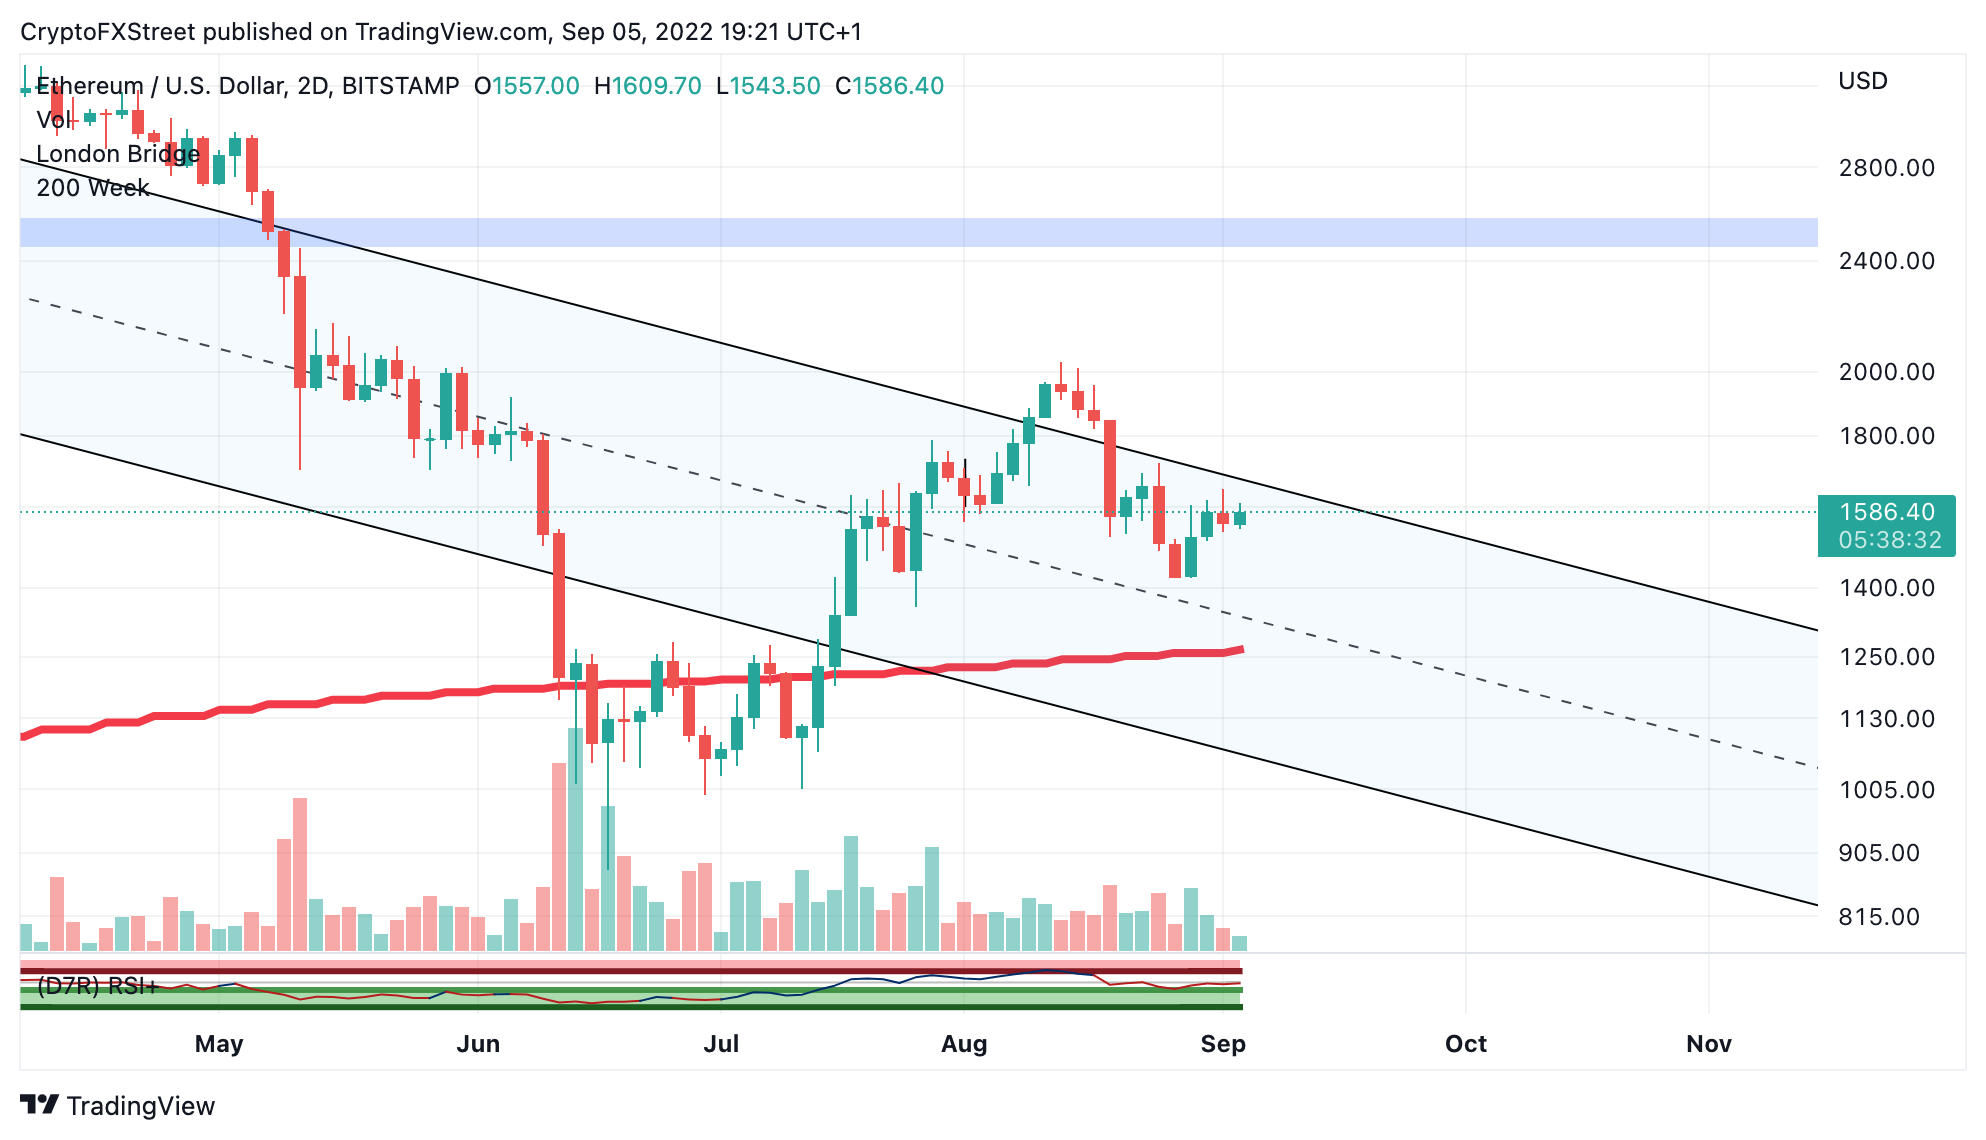
ETH USDT 2-Day Chart
On Chain Metrics
According To CryptoQuant's Depositing Transactions on All Exchanges Indicator, Ethereum saw the largest amount of deposits since its inception. On July 25, the exchanges saw 640,000 transactions, nearly seven times the average daily range. In theory, more deposits on an exchange indicate a higher probability of selling. On September 3, The Ethereum price saw an additional 200,000 transactions.
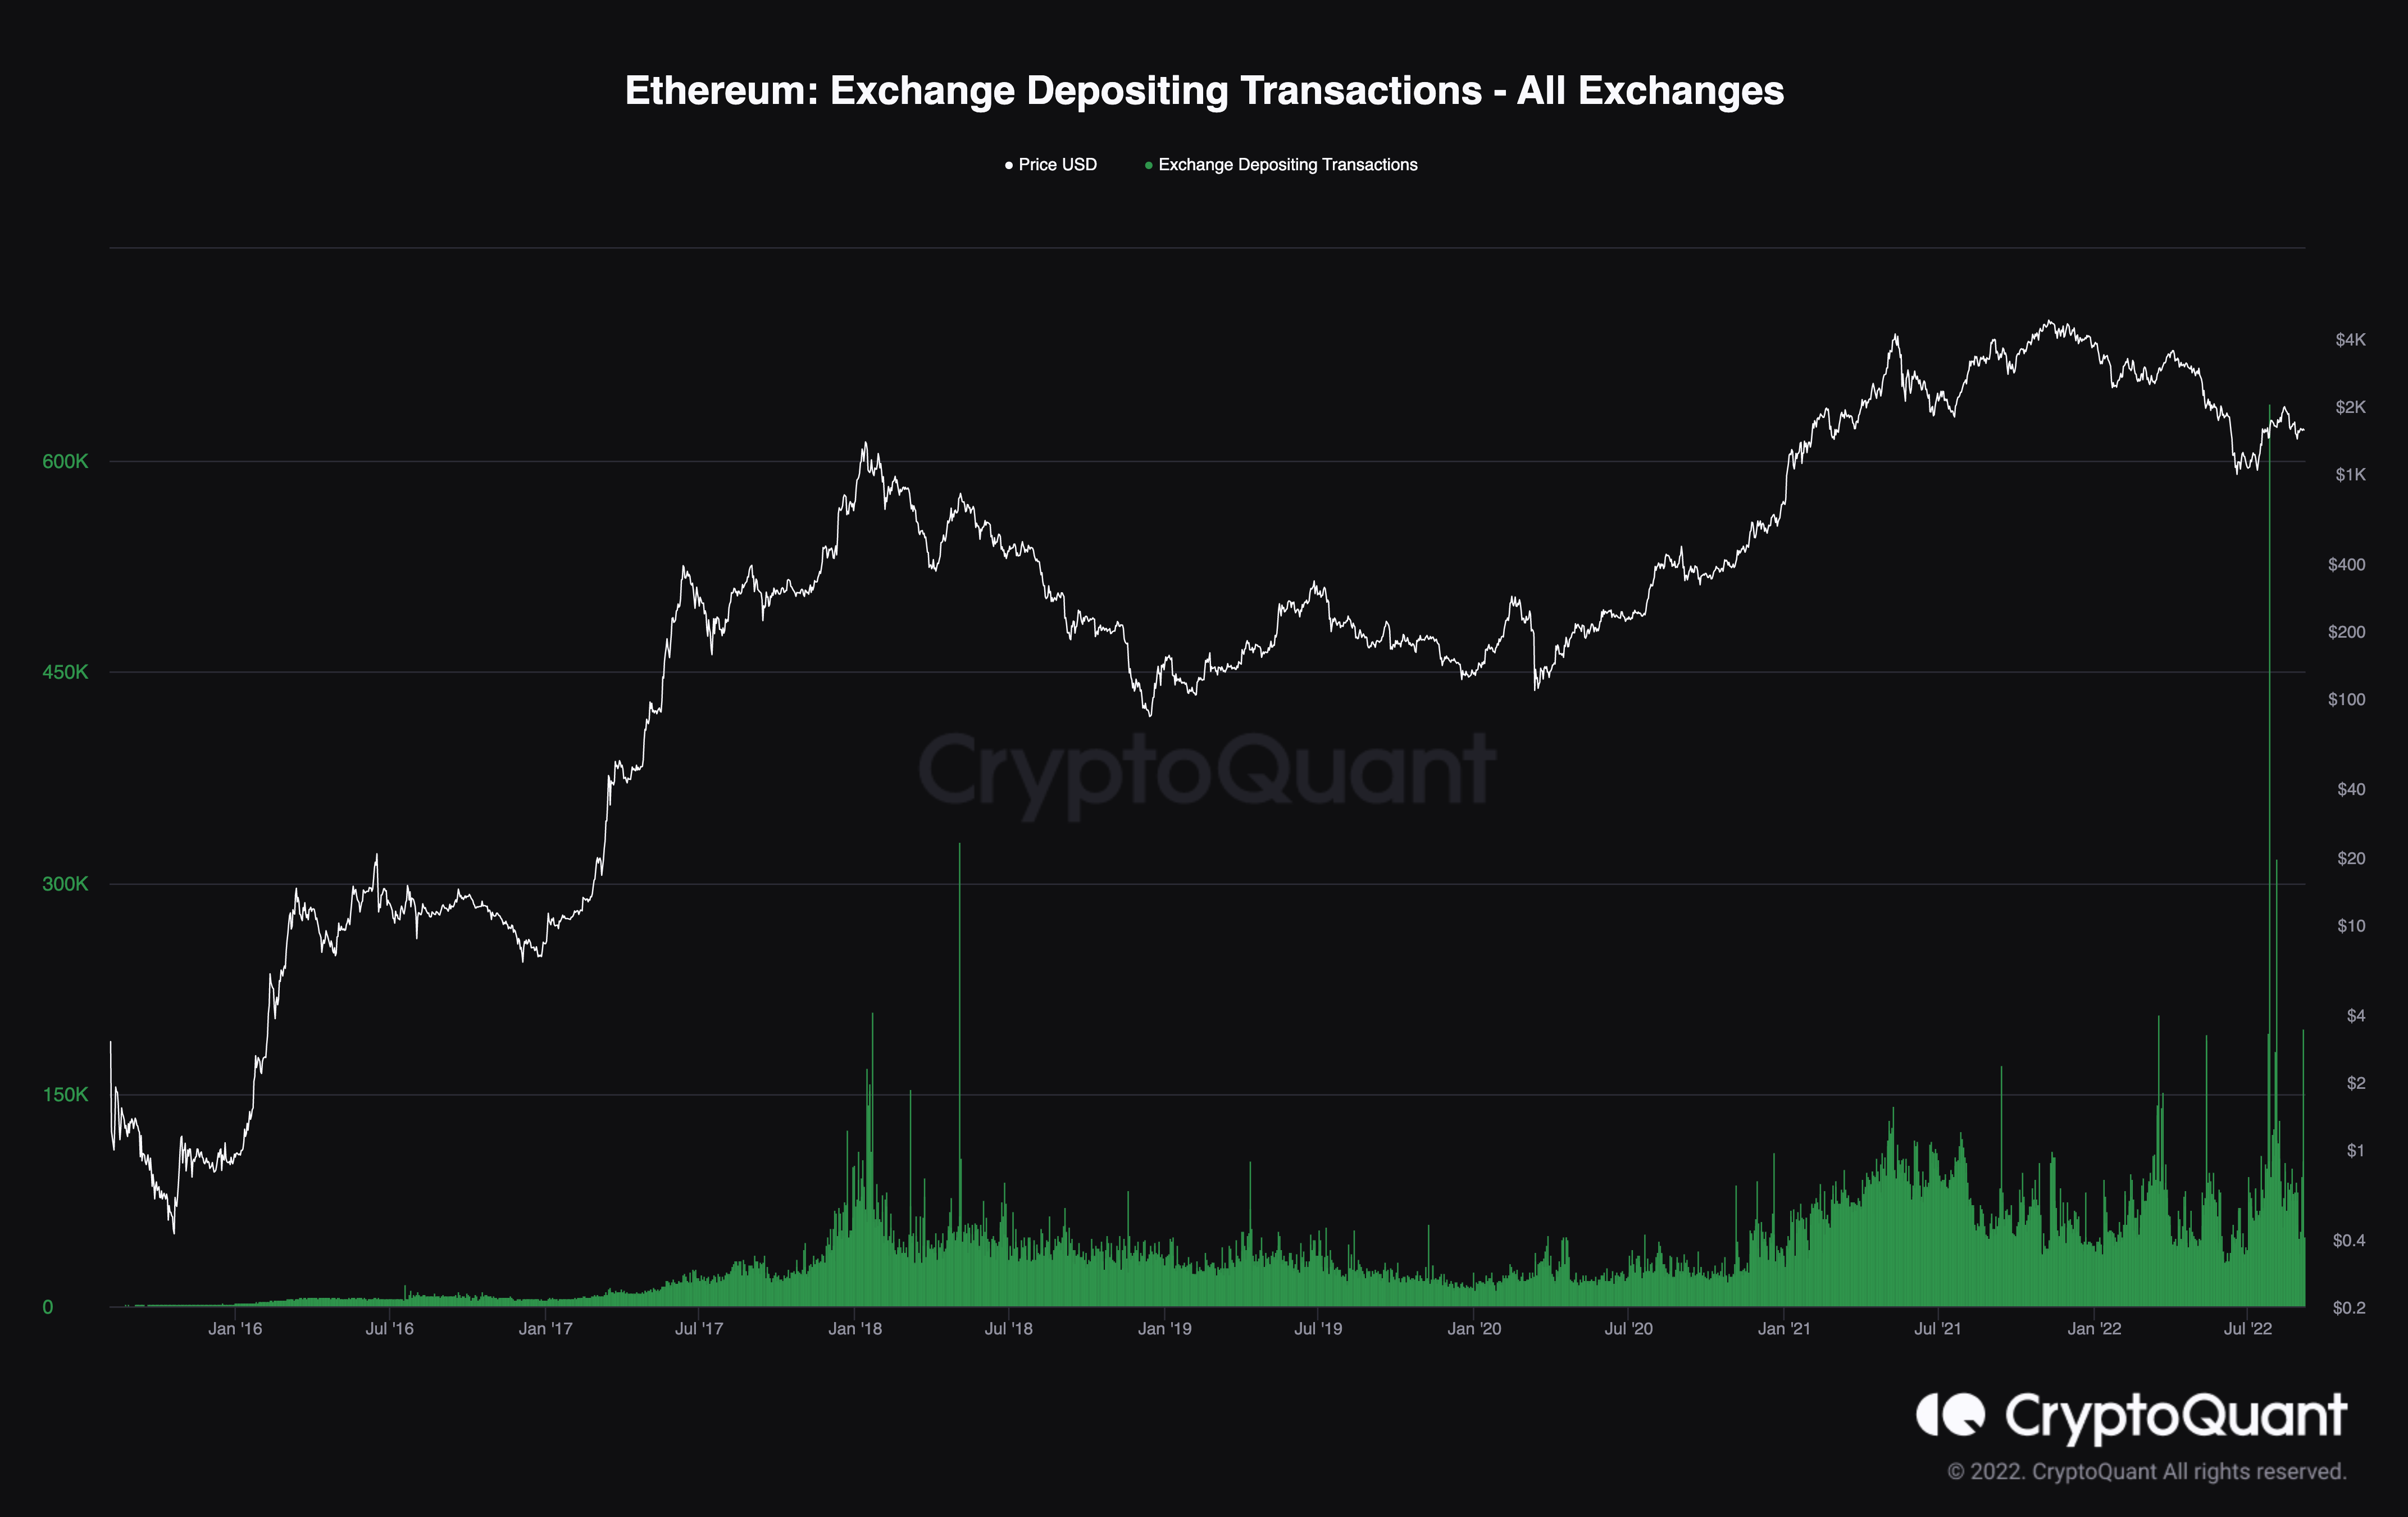
Crypto Quants’ Exchange Depositing Transactions Indicator
When combined, high-cap Ethereum traders are clearly participating in the market and could significantly influence the Ethereum price in the coming weeks. A cautious trading mindset should be applied based on confounding variables.
In the following video, our analysts deep dive into the price action of Ethereum, analyzing key levels of interest in the market. -FXStreet Team
Ripple price is on the move
Ripple's XRP price may hint at a large liquidation underway. Last week, 1 billion tokens re-entered the circulating supply. The inflation of tokens is a result of Ripple's escrow program. According to Ripple,
"The XRP Ledger's escrow system is designed to handle two use cases. The one that gives it its name is its ability to lock funds on the ledger subject to release to one of two accounts depending on whether a particular condition occurs by a particular time."
Though the use of wording is subject to interpretation, there are more on-chain metrics signaling a sell-off is coming soon. Santiment's 365-day Circulating Supply Indicator has shown an uptick in transactions of active wallets.
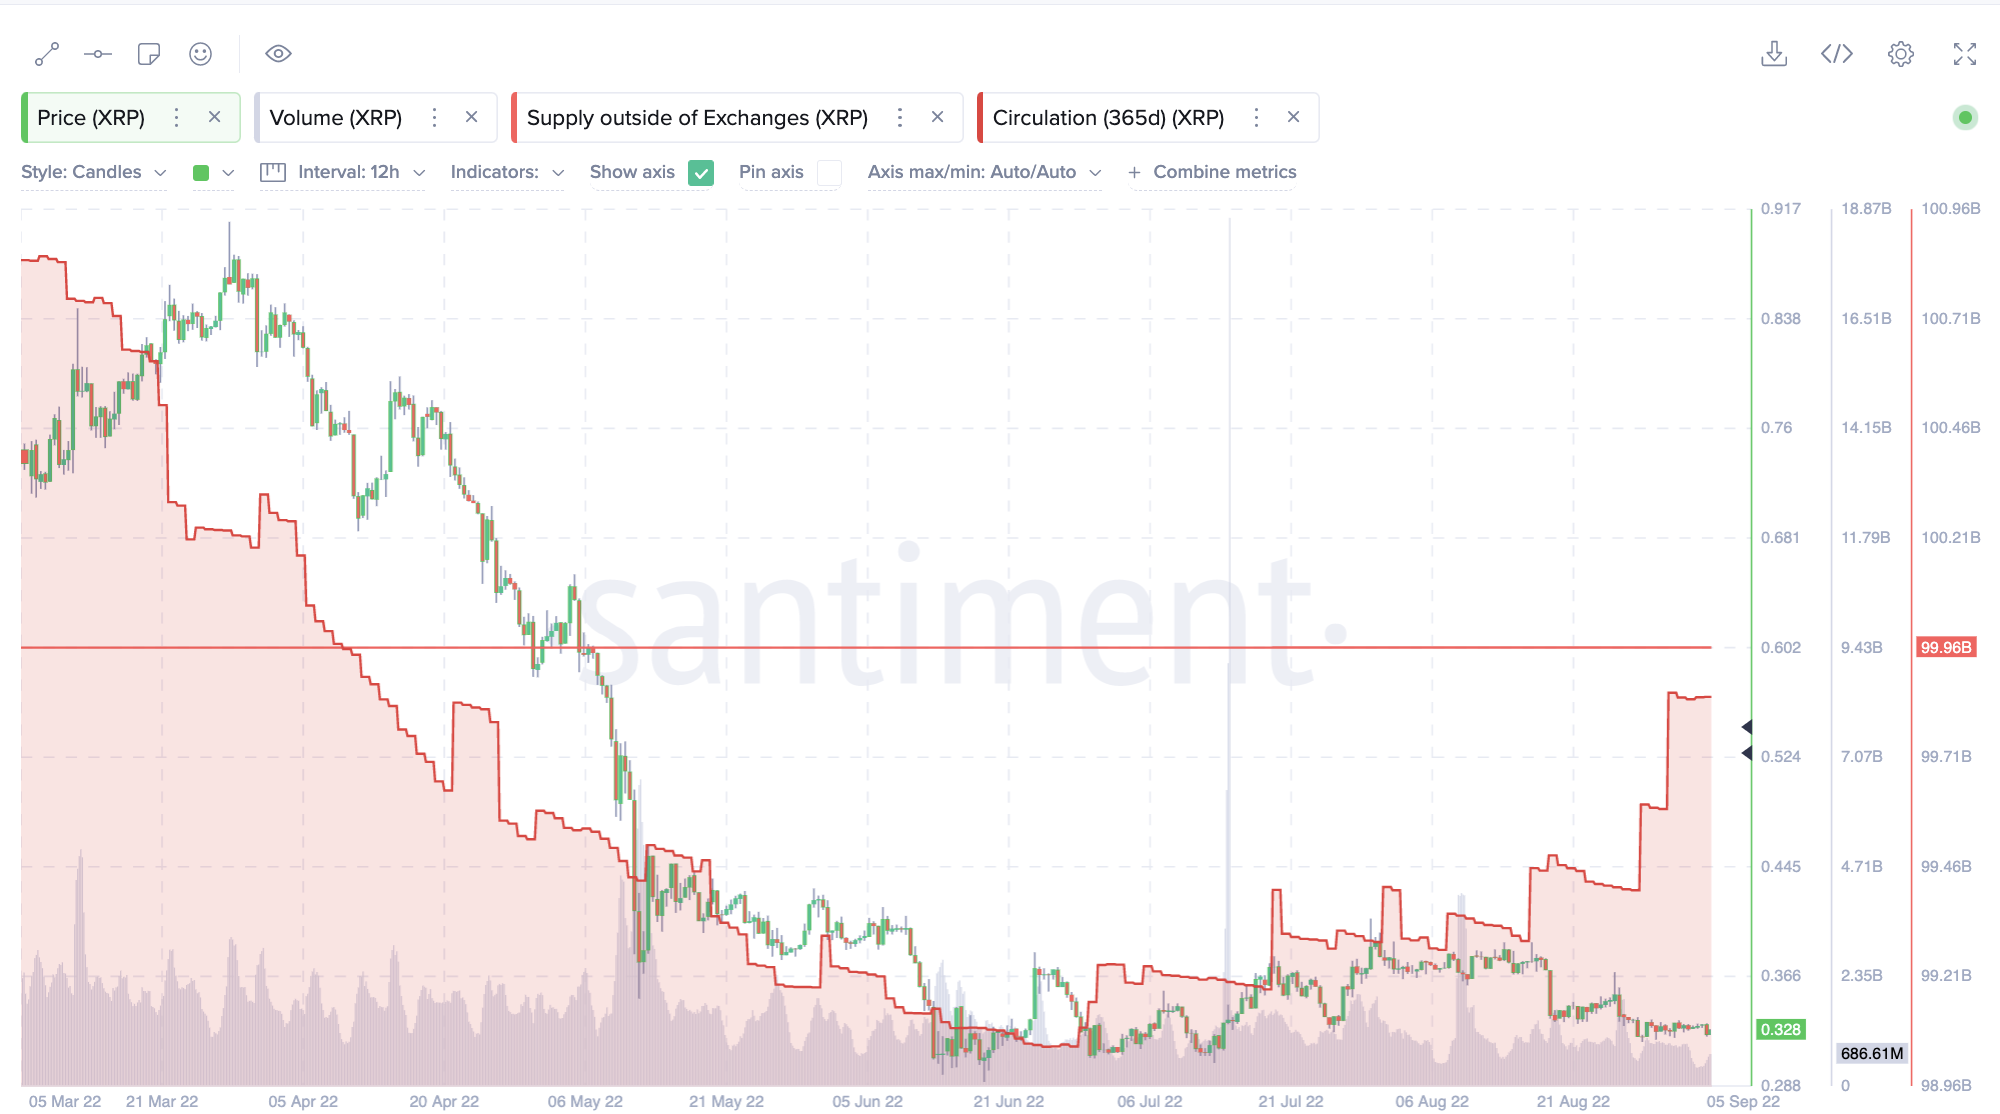
Santiment’s Price, Volume, Supply Outside of Exchanges, and 365 Circulation Indicators
The indicator's momentum is increasing by 200 million coins every few days. If market conditions persist, the circulating supply will collide with the total Supply Outside of the Exchanges' threshold, currently positioned at 99 billion tokens. This could be an on-chain signal whales are looking for to begin offloading their tokens.
In the following video, our analysts deep dive into the price action of Ripple, analyzing key levels of interest in the market. -FXStreet Team
Author

Tony M.
FXStreet Contributor
Tony Montpeirous began investing in cryptocurrencies in 2017. His trading style incorporates Elliot Wave, Auction Market Theory, Fibonacci and price action as the cornerstone of his technical analysis.


