Top 3 Price Prediction Bitcoin, Ethereum, Ripple: Wait-and-see approach seems prudent
- Bitcoin price has yet to prove its ability to gain further strength after finding support on dips below $26,200.
- Ethereum price has exhausted the symmetrical triangle without a directional bias, but the odds favor the downside.
- Ripple price must break above the multi-month resistance at $0.542 for more gains.

Bitcoin (BTC) price remains below the foothold of a slow-moving Simple Moving Average (SMA), suggesting a lack of buyer participation despite the common belief that US regulators’ warpath will not cause global problems for crypto. The king of crypto’s mood has affected the crypto top ten, including Ethereum (ETH) and Ripple (XRP).
Also Read: SEC triggers crypto bloodbath as Coinbase, Kraken brace for token delistings after Binance lawsuit
Bitcoin price is yet to show its hand
Bitcoin (BTC) price has recovered from almost 10% losses that followed the regulatory attack on Binance. While most recoveries indicate fresh momentum, the case is different for BTC now, as the king of crypto remains under the foothold of the 50-day SMA at $27,618. Notably, this hurdle has dominated since May 7.
Unless bulls flip the 50-SMA into support, selling pressure from this level could repel Bitcoin price to retest the local multi-week support at $25,659, where buyers could regroup for the fourth time.
Further, Bitcoin price would need a lot more momentum for a break above the supply zone indicated by the red band on the chart. Selling pressure from this zone is expected to nullify every bullish attempt. Considering that the Relative Strength Index (RSI) was topping south to show a falling momentum, BTC holders and traders may have to wait longer.
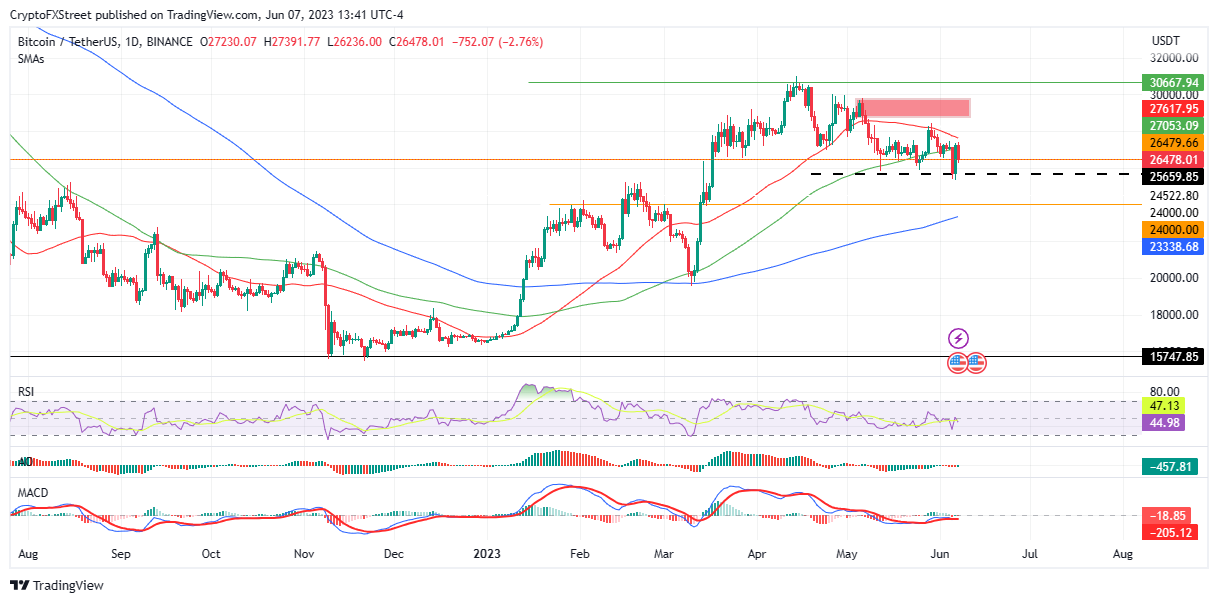
BTC/USDT 1-Day Chart
Nevertheless, bulls overpowering the bears would catapult Bitcoin price beyond the seller-dominated zone to sweep liquidity above it.
Also Read: Bitcoin price recovers to $27,000 even as SEC files to freeze Binance.US assets
Ethereum price lacks directional bias
Ethereum (ETH) price has filled a symmetrical triangle after weeks of consolidation with growing volatility. However, contrary to expectation, the largest altcoin still lacks directional bias after escaping the technical formation.
A breakout could be imminent for ETH if Ethereum price breaches above the 50-SMA at $1,857, marking the first step north. However, a daily candlestick close above the $2,128 resistance level would only validate the bullish outlook. Nevertheless, this is highly unlikely in the short term considering the need for more momentum as indicated by the RSI at 49 and heading south. Confirmation is to be sought above the $1,949 level.
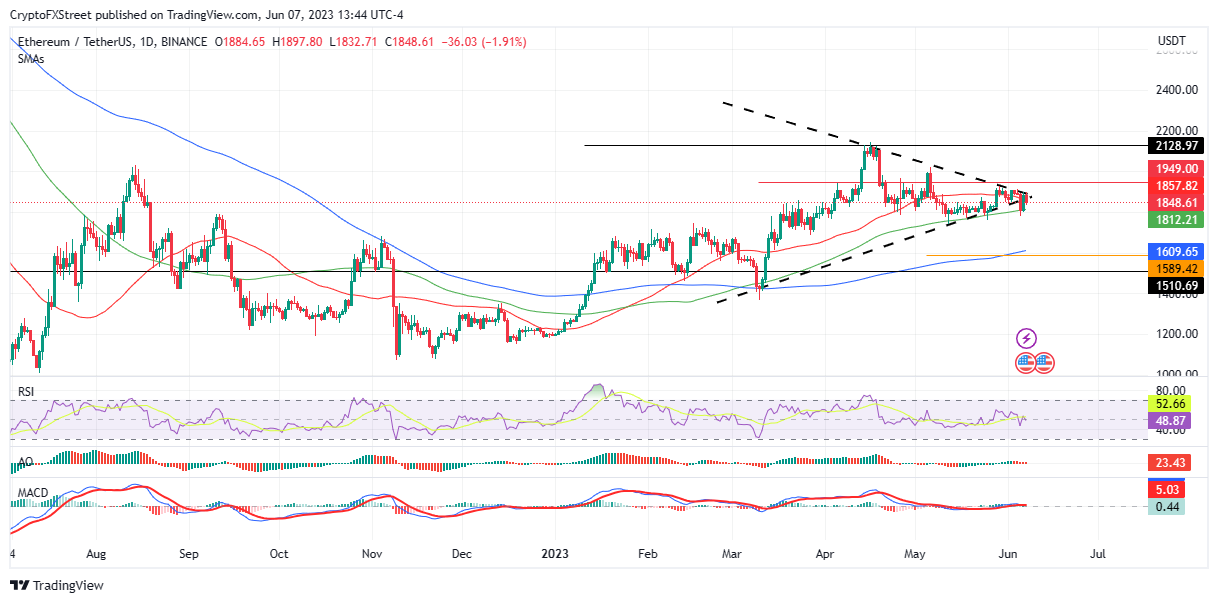
ETH/USDT 1-Day Chart
Conversely, Ethereum price breaking below the 100-day SMA could spell doom for ETH bulls in the short term as buying pressure from this supplier level continues to bode well for ETH.
Ripple price faces a congested path south
Ripple (XRP) price has abandoned its impulsive move north, falling around 10% from the intra-day high of $0.547 recorded on June 4. Notably, the correction comes as ETH continues to find selling pressure to cap its rally around the $0.542 level. Notably, this zone has limited the upside for XRP for months, with the ensuing correction sending the remittance token’s market value down in double-digit percentages.
Failure to flip it into support could see Ripple price drop towards the demand zone before kickstarting a recovery rally bolstered by the demand zone. Nevertheless, the Relative Strength Index points to a decreasing momentum that could see XRP slum in market value.
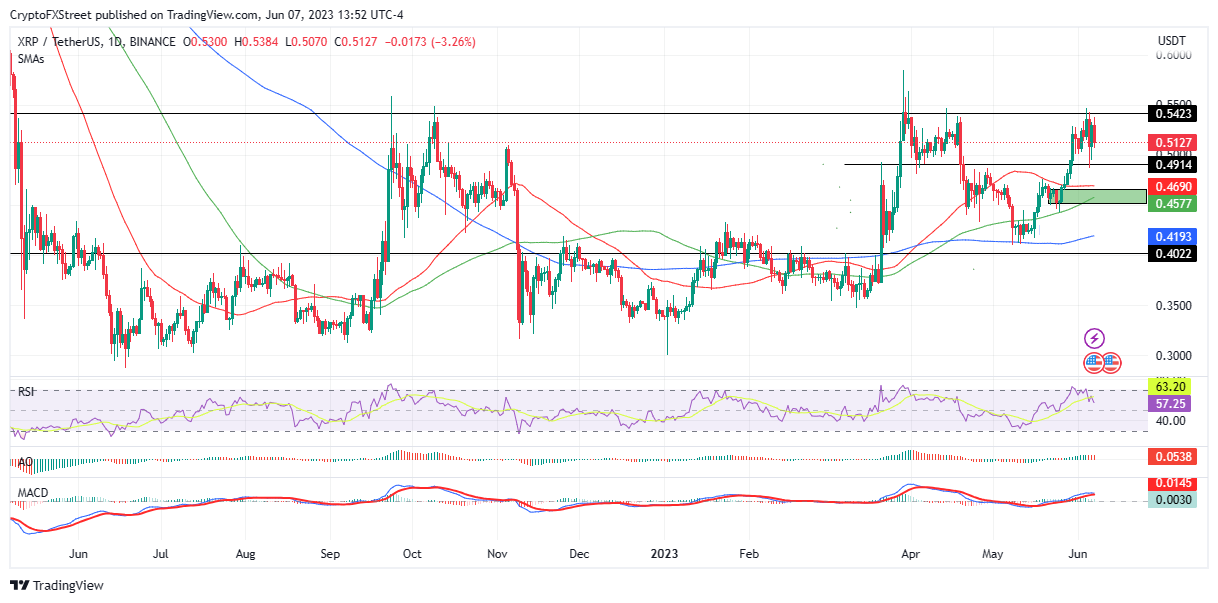
XRP USDT 1-Day Chart
On the other hand, an influx in buyer momentum could see Ripple price break above the immediate barricade at $0.542, clearing the path for more gains.
Also Read: Ripple price eyes 25% breakout as XRP community anticipates June 13
Author

Lockridge Okoth
FXStreet
Lockridge is a believer in the transformative power of crypto and the blockchain industry.