Ripple price eyes 25% breakout as XRP community anticipates June 13
- Ripple price is coiling up for a breakout amid revitalized optimism in the community, counting the days to June 13.
- XRP could explode 25% to new range highs, levels last seen in May 2022.
- Invalidation of this bullish outlook will occur upon a daily candlestick close below $0.49.

Ripple (XRP) price has been bullish since mid-May, basking in the hype of victory in the lawsuit against the US Securities and Exchange Commission (SEC) edging closer. As it happened, optimistic chatter around the subject continues to excite the XRP community, and now the remittance token appears poised for another breakout.
Also Read: Pro-XRP lawyer: Ripple losing the SEC lawsuit might be a blessing in disguise
Ripple price eyes $0.65 as the fifth anniversary of Hinman’s speech approaches
Ripple (XRP) price indicates a motivated bull market, with XRP coiling up for another breakout. The excitement comes as the fifth anniversary of Hinman’s speech approaches, June 14. With it, pro-XRP lawyer John Deaton has committed to holding a panel discussion to unseal the documents a day before D-day.
Stand by b/c I’m moving @CryptoLawUS weekly livestream from Tuesday June 13 to June 14 - the 5th Anniversary of the Hinman Speech. We will have had 12-24 hours to read the emails, comments and drafts. And I promise an all star lineup of guests to help process what it all means. https://t.co/omZm9pXVZb
— John E Deaton (@JohnEDeaton1) June 1, 2023
Notably, the Hinman documents are critical in the Ripple vs. SEC case and have a bearing on the movement of the XRP price, which has molded into an inverse head and shoulder pattern on the daily timeframe. An inverse head and shoulder pattern is a technical formation signaling an upcoming bullish trend after a period of a bearish trend or consolidation (in this case).
The pattern is formed by three successive price bottoms, two shoulders, and a head. The head is the middle bottom, which is at the lowest level, while the shoulders are the two other bottoms that are higher on both sides. The neckline connects the three bottoms. Once the price crosses above this neckline and the target forecasted, the pattern is completed by measuring the distance between the neckline and the head and superimposing it from the expected breakout point northwards.
At the time of writing, the remittance token was trading just below the neckline as it tried to actualize the governing chart pattern before the weekend ended. This set XRP up to go ballistic toward the technical target of the inverse H&S set up at $0.65, as shown on the daily chart below.
However, before this can happen, the bulls must ensure a daily candlestick close above the $0.54 barrier, a level last tested on April 14. Notably, Ripple was turned away from that supplier congestion zone in March and April, leaving a lot of uncollected liquidity above it. Leveraging this liquidity would bode well for XRP bulls.
Note that the chart pattern would be confirmed if the price breaks above the neckline at $0.53, paving the way for the target of the governing chart pattern around $0.65, approximately 25% above the current price.
Besides the technical pattern, the Exponential Moving Averages (EMA) support XRP’s positive outlook. The Ripple price trades above the EMAs: the 50-, 100- and 200-day EMA $0.47, $0.45, and $0.44, respectively. These offered robust support where buyers could regroup before scaling another uptrend.
Also, the Relative Strength Index (RSI) was headed north, suggesting a rising momentum. This could bode well for Ripple price.
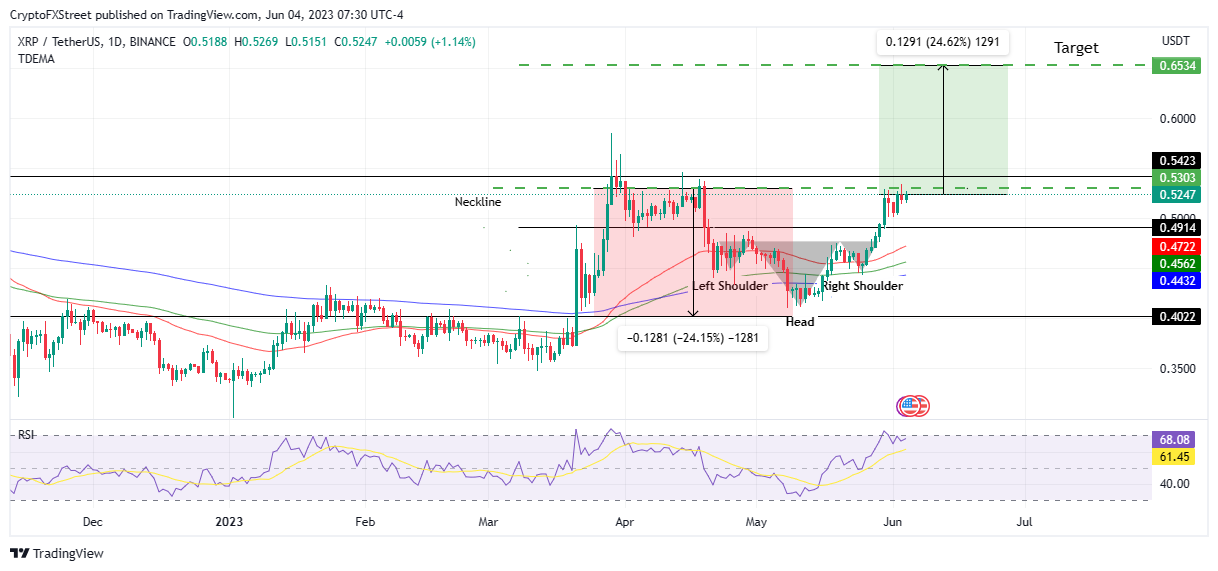
XRP/USDT 01-Day Chart
Conversely, if profit takers pull the trigger, Ripple price could retrace toward the $0.49 support, invalidating the bullish outlook. Notably, the RSI at 68 suggested XRP would be overbought soon, a move often followed by a correction or pullback.
Such an outcome could see Ripple price drop below the three EMA, or in the dire case, find solace around the $0.40 swing low.
Author

Lockridge Okoth
FXStreet
Lockridge is a believer in the transformative power of crypto and the blockchain industry.


