Top 3 Price Prediction Bitcoin, Ethereum, Ripple: Time to row, not sail as crypto majors remain stranded in ranges
- Bitcoin price holding the strategically important 50-week simple moving average (SMA) after a breakout from a rising wedge.
- Ethereum price continues to hold the ascending 2020 trend line after a breakout from a rising wedge.
- XRP price widening trading range, but remains dead money for long-term investors.

Bitcoin price breakout from the rising wedge does assert downside pressure on the flagship cryptocurrency, but support levels abound below the current price. Ethereum price action is governed by a developing descending triangle that began on May 20. Meanwhile, XRP price remains directionless, offering no clues about long-term intentions and frustrating investors seeking the explosive gains that marked trading until the April high.
Bitcoin price churn should continue until precise levels are broken
On May 19, Bitcoin price closed at $36,731 after reaching an intra-day low at the psychologically important $30,000. Currently, BTC is trading at $33,604, indicating that the flagship cryptocurrency is actually down 8.5% over the last 50 trading days and proving that price pays, not spectacularly articulated visions of the future. In fact, if market operators had focused on Bitcoin price, they would have enjoyed several swings of 20-30%, generating sizable portfolio outcomes. Hence, there are times to sail and times to row.
Yesterday, Bitcoin price fell from a rising wedge pattern that had ruled BTC since the June 22 low of $28,800, raising the probability that the risk for the digital asset is tilted to the downside for the foreseeable future.
The measured move of the rising wedge pattern is 27%, indicating an ultimate Bitcoin price low of $25,000 for this leg lower. It would be a convincing blow to the lingering BTC bullish narrative and, more importantly, turn the formidable support around $30,000 into a stressing level of resistance for any rebound attempts.
The BTC decline would also confirm the breakdown from the larger head-and-shoulders pattern, first triggered on June 22, and dismantle the support gifted by the 61.8% Fibonacci retracement level of the 2020-2021 rally at $27,175.
To avoid the bearish outcome, Bitcoin price needs to hold the 50-week SMA at $31,445 and the head-and-shoulders neckline at $30,600 on a weekly closing basis.
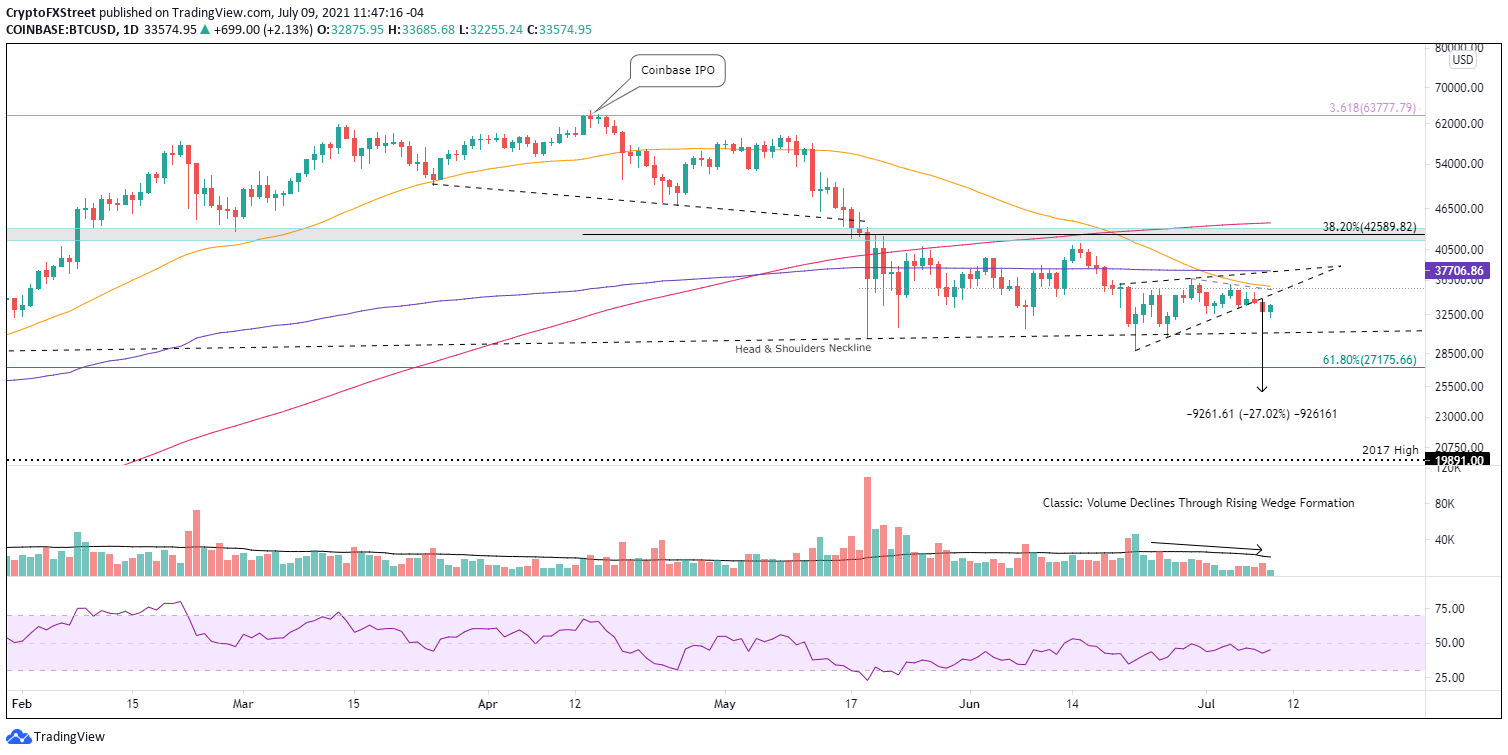
BTC/USD daily chart
Unless Bitcoin price can register a daily close above the wedge’s upper trend line and the Anchored VWAP from October 21 at $37,706, it is anticipated that BTC will, at best, continue the churn that has dominated the trading since May 19.
Here, FXStreet's analysts evaluate where BTC could be heading next as it seems bound for a rebound.
Ethereum price sticks at support, but a bearish tone still prevails
Ethereum price closed yesterday below the lower trend line of a rising wedge pattern at $2,330, resolving the price structure that had commanded ETH since the June 22 low. Moreover, the smart contracts giant traded below the secondary confirmation point of $2,160 before pausing at the February high at $2,041, raising the odds of the bearish resolution gaining momentum in the days ahead.
The measured move of the rising wedge pattern is the June 26 low of $1,717, representing a drop of about 20% from the current price. The move would erase the support at the February high of $2,041, the 200-day SMA at $2,008 and the critical ascending 2020 trend line now at $1,930.
A weekly close below $1,717 would trigger the larger descending triangle pattern (highlighted in blue) and introduce ETH investors to a dangerous forecast that includes an additional 40% decline based on the measured move of the triangle. A 40% decline from the triangle breakout would equate to a price below $1,000.
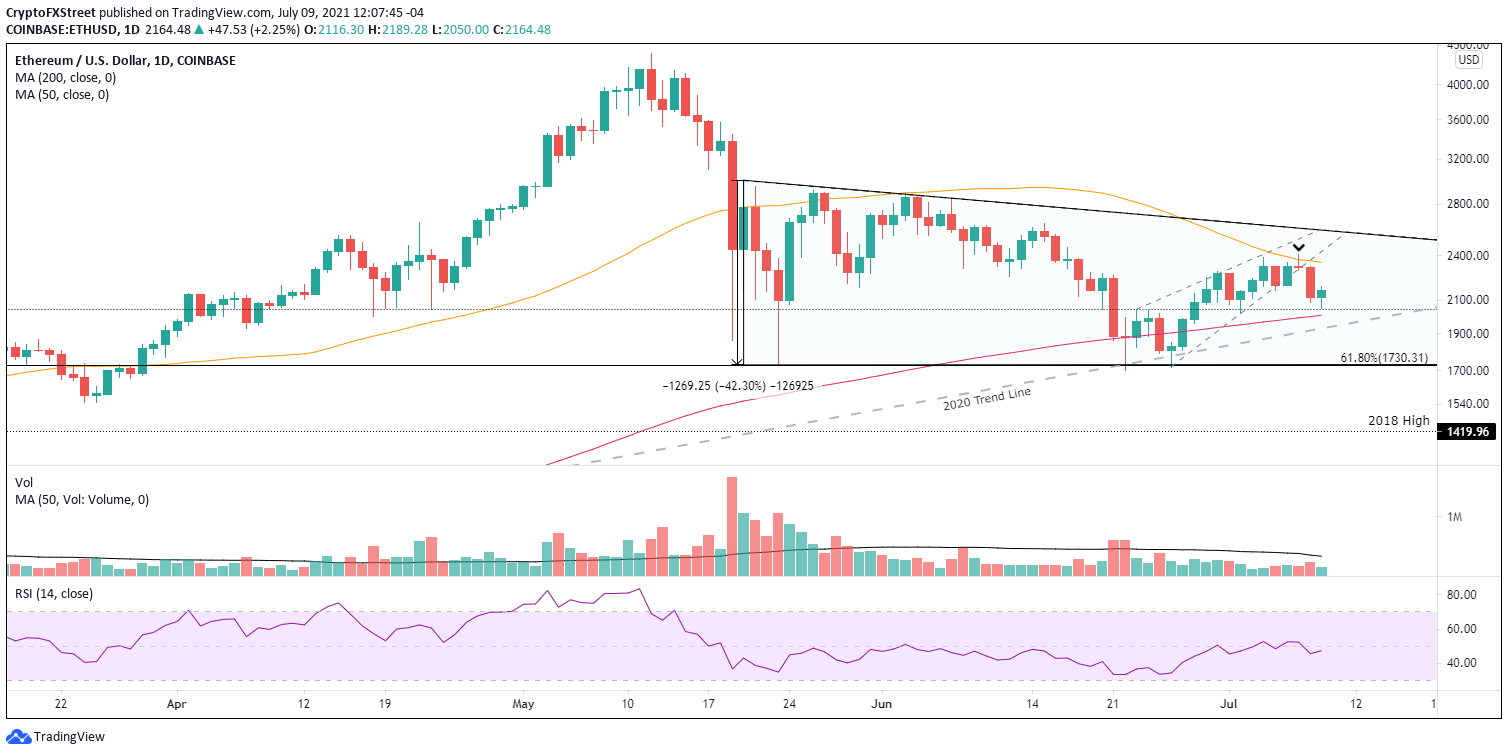
ETH/USD daily chart
A daily close above the 50-day SMA at $2,351 would void the interim bearish outlook, but Ethereum price will still be challenged by the descending triangle’s upper trend line, now at $2,590. Hence, there is no easy road ahead for the ETH bulls.
The momentum low was on May 23, but Ethereum price continues to search for a price low. It may have occurred on June 22, but the bias of the charts on various timeframes is negative, suggesting lower prices, or at best, more range-bound trading.
Here, FXStreet's analysts evaluate where ETH could be heading next as it seems bound for an upswing.
XRP price remains dead money for long-term investors
On July 1, XRP price fell from a minor rising wedge pattern before shifting into a consolidation along the critically important support at $0.650. Yesterday, the international settlements token fell below the support, thereby enlarging the price range and possibly signaling a renewed push to test the 78.6% retracement level at $0.555 and sweep the June 22 low of $0.512.
The wedge’s measured move is approximately 30%, suggesting that XRP price will best the Fibonacci level and the June low before identifying support around $0.477. From the current Ripple price, it translates into a 25% decline.
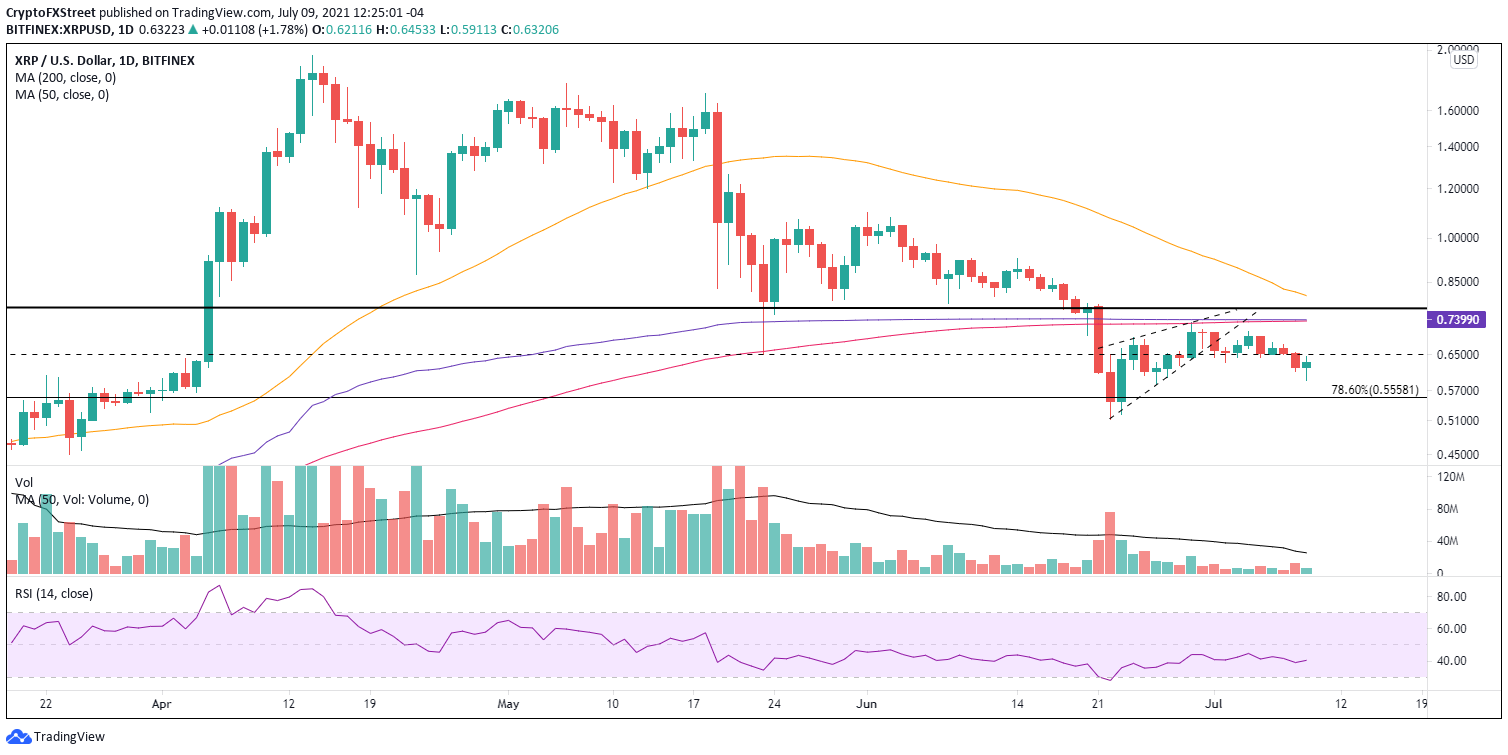
XRP/USD daily chart
At best, XRP price will continue to trade in a range defined by $0.760 on the upside and either $0.650 or $0.555 on the downside. Only a daily close above $0.760 would alter the neutral to the bearish narrative being portrayed in the Ripple charts.
If a market spectator only reviewed the price action of the three major cryptos from the collapse on May 19, it would be clear that it has been a challenging environment, affording brief trade opportunities but no conclusive trend resolution. Therefore, in a market manipulated by uncertainity and diverging forecasts, it is preferable to row not sail until there is clear visibility about the future trend and the necessary confirmation.
Here, FXStreet's analysts evaluate where Ripple could be heading next as it seems bound for an upswing.
Author

Sheldon McIntyre, CMT
Independent Analyst
Sheldon has 24 years of investment experience holding various positions in companies based in the United States and Chile. His core competencies include BRIC and G-10 equity markets, swing and position trading and technical analysis.


