Ethereum Price Prediction: ETH decline just beginning, primed to fall another 20%
- Ethereum price drops over 7%, breaking the rising wedge pattern that has dominated price action since June 22.
- Declining 200 six-hour simple moving average (SMA) halts rally, highlighting the importance of the complicated resistance level.
- February high at $2,041 is critical support if the current decline accelerates during the trading day.

Ethereum price triggers a rising wedge pattern with a resounding decline of over 7% at the time of writing. Rumors of a delay for the London hard fork have been presented as the reason for today’s fall, but the charts already offered clear evidence that ETH was ready for a decline. Based on the price structure, not the rumors, the smart contracts giant could decline a further 20%.
Ethereum price charts projected the decline, as ‘price pays’
The drop of 7% for Ethereum price is not a surprise for chartists, as price always leads the news or other fundamental developments. Specifically, ETH plotted a clear rising wedge pattern from the June 22 low, defined by corrective price action and muted volume levels.
Rising wedge formations can be tricky because they slope against the prevailing downtrend, creating the illusion that the cryptocurrency (in this case) has finalized a bottom and is beginning a new uptrend. Often the formation triggers with a bigger than average decline after striking some critical resistance.
In the case of ETH, Ethereum price first struck resistance at the 200 six-hour SMA at $2,388 on July 6 and further attempts to overcome the level were rejected. During the moving average test and the resulting price high, the digital asset flashed a bearish momentum divergence when the six-hour Relative Strength Index (RSI) did not confirm price, thus intensifying the downward pressure on ETH.
The primary confirmation of a breakdown is a daily close below the wedge’s lower trend line at $2,330. The second confirmation is a trade below $2,160.
With the decline today, Ethereum price is going to confirm the breakdown from the bearish rising wedge pattern. As a result, investors need to consider a fall to the measured move target of $1,842, representing a drop of 20% from the current price. The ETH target equates to the trough of the rising wedge formation, printed on June 26.
Standing in the path to the measured move is the 50 six-hour SMA at $2,159, the February high of $2,041 and the ascending 2020 trend line at $1,900.
It is important to note that the rising wedge pattern is occurring within a larger descending triangle pattern (highlighted in blue), so a weekly close below $1,842 may introduce a more significant sell-off with major long-term implications.
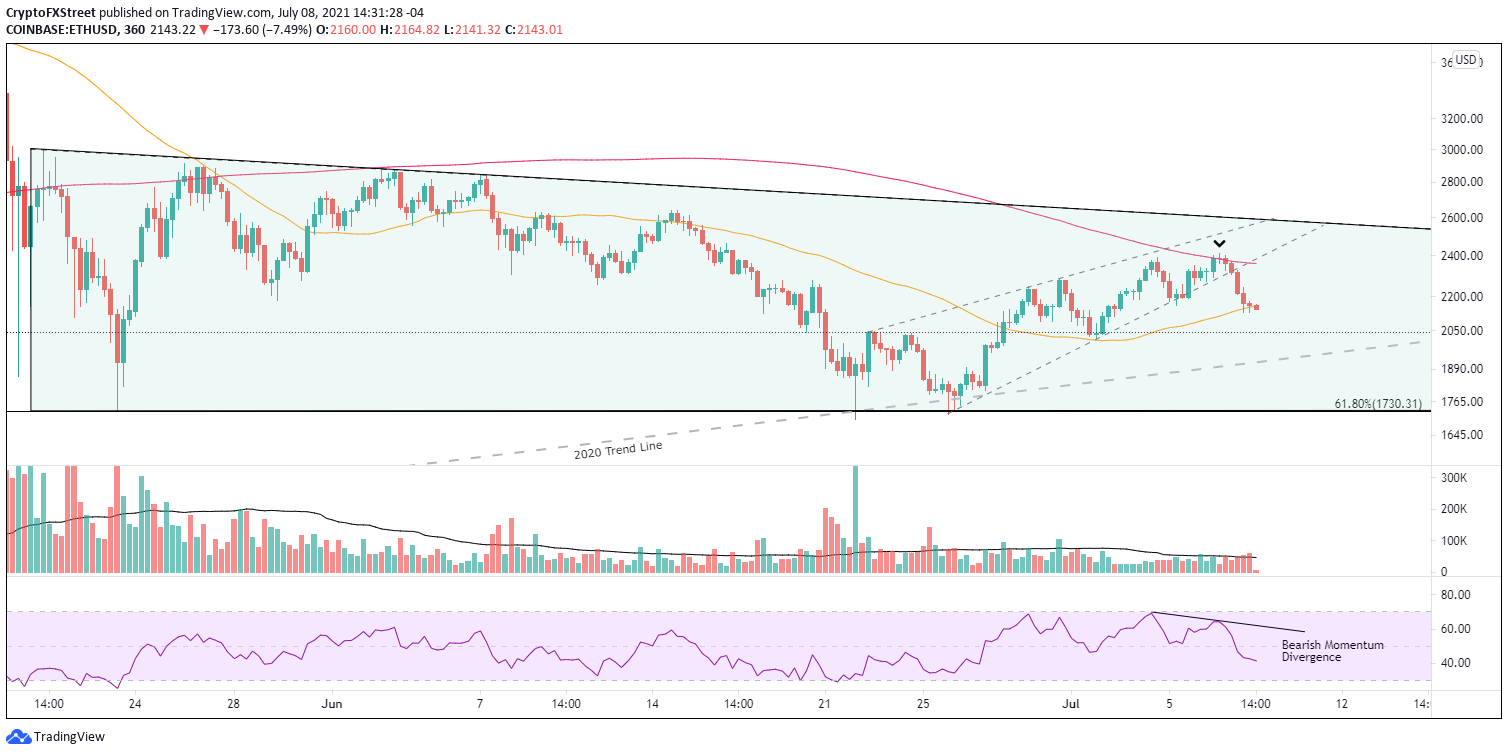
ETH/USD 6-hour chart
Only a daily close above the 200 six-hour SMA at $2,362 and the wedge’s lower trend line, currently at $2,380, would void the bearish ETH narrative.
It is often said that ‘price pays,’ and the current ETH example validates that statement. The charts were already forecasting a problematic situation for Ethereum price due to the chart formation, considerable resistance and the persuasive momentum divergence. If the resulting projection holds, the leading altcoin is just beginning another leg lower for the uncomfortable bottoming process playing out since the May 23 low.
Here, FXStreet's analysts evaluate where ETH could be heading next as it seems bound for a correction before higher highs.
Author

Sheldon McIntyre, CMT
Independent Analyst
Sheldon has 24 years of investment experience holding various positions in companies based in the United States and Chile. His core competencies include BRIC and G-10 equity markets, swing and position trading and technical analysis.


