Top 3 Price Prediction Bitcoin, Ethereum, Ripple: Skepticism soars as Bitcoin wobbles from $60,000
- Bitcoin pivotal at $58,000 after incurring brief losses from highs near $60,000.
- Ethereum is hovering at $1,800 following rejection from $1,850.
- Ripple seeks support at 50 SMA on four-hour chart to avert declines heading to $0.4.

Bitcoin dropped sharply and briefly during the European session on Wednesday, leaving many retail investors liquidated. Over the last few days, BTC and Ethereum tried to lift above key levels at $60,000 and $1,800, respectively, but struggled to sustain the gains.
Ethereum is dancing roughly at $1,800 at the time of writing, while Bitcoin is pivotal at $58,000. The cross-border token Ripple has lost approximately 5% of its value to trade at $0.55. Most cryptocurrencies are in the red apart from some selected altcoins such as Filecoin, BitTorrent and Holo.
Bitcoin eyes technical breakdown to $52,000
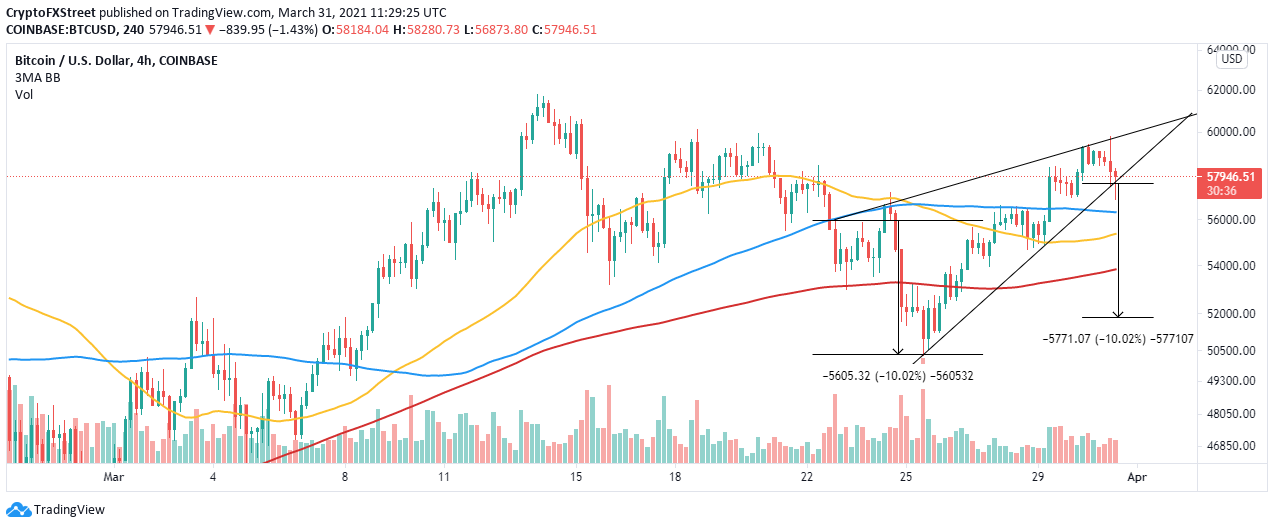
Bitcoin has printed a rising wedge pattern on the four-hour chart. This is a bearish pattern molded by two rising trend lines connecting the asset's higher highs and higher lows. The pattern is distinct, because it contracts to the upside as the trading range narrows.
Contrary to the symmetrical triangles, which have no bearish or bullish bias, a rising wedge pattern usually results in a breakdown. For instance, BTC may drop by 10% to test support at $52,000.
Various support levels are in line to provide anchorage, including the 100 Simple Moving Average (SMA) on the four-hour chart near $56,000, the 50 SMA close to $55,400, and the 200 SMA holding around $53,840.
BTC/USD four hour chart
It is worth mentioning that Bitcoin may ignore the pessimistic outlook if it manages to hold above $58,000. Market stability is likely to build at this position as buyers shift their focus to levels past $60,000.
Ethereum struggles to secure higher support
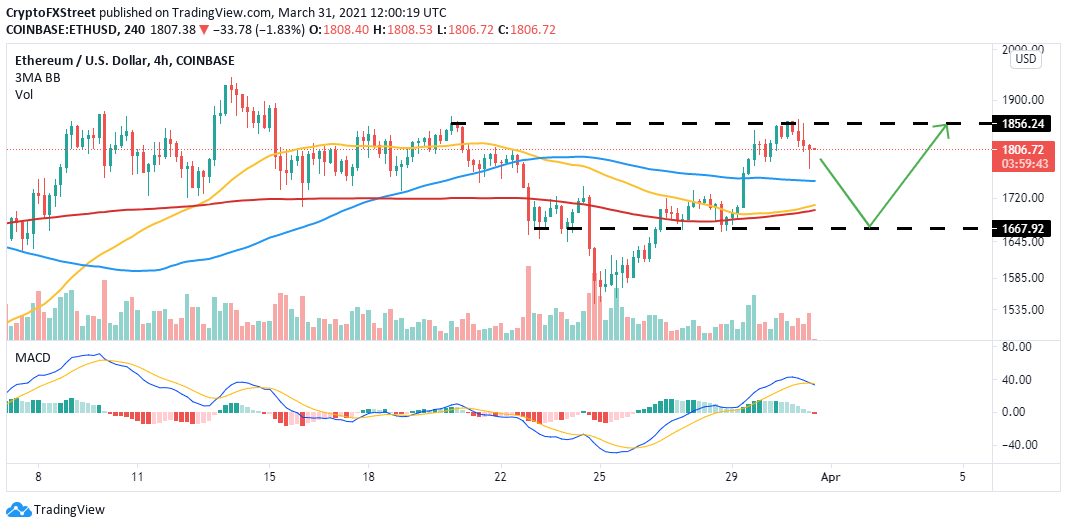
Ether made its way above $1,800, which seemed to have validated the anticipated upswing to $2,000 — however, a barrier at $1,850 cut short the uptrend, allowing bears to come into play. The pioneer smart contract token corrected back to $1,800 and is currently seeking support at this same level.
The four-hour Moving Average Convergence Divergence (MACD) indicator is about to flip massively bearish. Investors would be inclined to sell if the MACD line (blue) crosses under the signal line. This may send Ether under $1,800, triggering massive losses toward the support highlighted by the 100 SMA around $1,750.
If push comes to shove and Ethereum fails to secure higher support, declines will likely increase to the buyer congestion around $1,665 as discussed. The bearish leg may also extend to the primary anchor at $1,540, whereby bulls will stage a significant upswing.
ETH/USD 4-hour chart
Ripple resumes downtrend as overhead pressure shoots
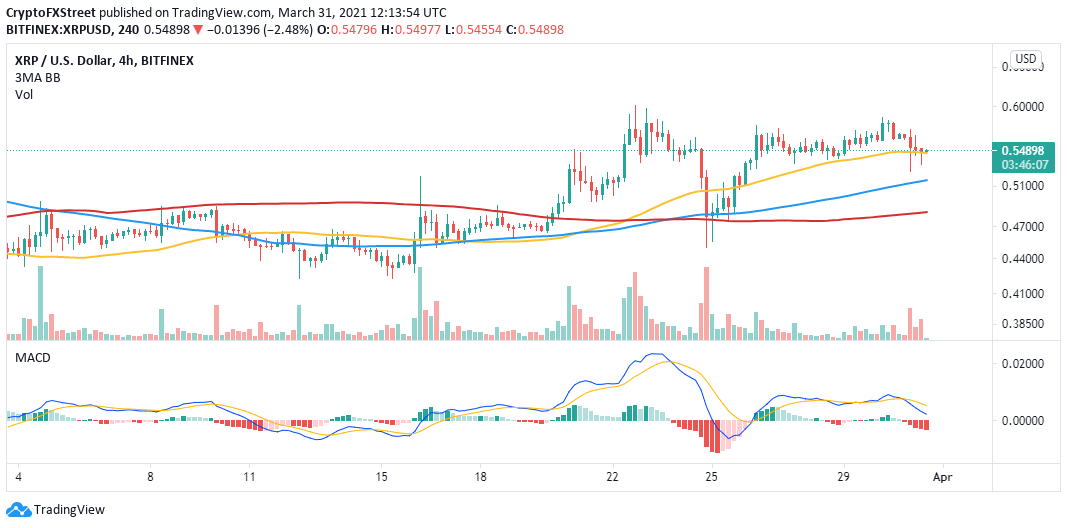
The international remittance token has retreated from the stubborn hurdle at $0.6 to trade at $0.54. The 50 SMA on the four-hour chart provides immediate support. Closing the day beneath this zone would validate the downtrend toward $0.5.
Meanwhile, the MACD has dived toward the mean line and is likely to cross into the negative territory. Additionally, the MACD line (blue) has increased the signal line's divergence, adding weight to the bearish outlook.
The 100 SMA and the 200 SMA provide support at $0.51 and $0.48, respectively. However, XRP's primary support is at $0.4 and $0.35.
XRP/USD 4-hour chart
On the other hand, holding above the 50 SMA for the rest of the day would encourage more buyers to join the market. An increase in the tailwind would bolster Ripple toward $0.6. Trading past this stubborn resistance is likely to pave the way for gains eyeing $0.65 and $0.75 in the order.
Author

John Isige
FXStreet
John Isige is a seasoned cryptocurrency journalist and markets analyst committed to delivering high-quality, actionable insights tailored to traders, investors, and crypto enthusiasts. He enjoys deep dives into emerging Web3 tren