Top 3 Price Prediction Bitcoin, Ethereum, Ripple: Possible moves as BTC goes back to consolidation mode
- Bitcoin price could break below the $24,995 level amid falling momentum and the effects of a dull market.
- Ethereum price risks a 5% slump for liquidity collection as the $1,630 support level barely holds.
- Ripple price coils up for an uptrend, potentially breaching the $0.5667 resistance level if current optimism sustains.

Bitcoin (BTC) price is back to consolidation after the recent Grayscale-infused data provided market impales. Ethereum (ETH) price is following in a path almost similar to BTC, but Ripple (XRP) price would not yield.
Also Read: Bitcoin price likely to fall 10% from current levels this September, crypto analyst says
Cryptocurrency metrics FAQs
What is circulating supply?
The developer or creator of each cryptocurrency decides on the total number of tokens that can be minted or issued. Only a certain number of these assets can be minted by mining, staking or other mechanisms. This is defined by the algorithm of the underlying blockchain technology. Since its inception, a total of 19,445,656 BTCs have been mined, which is the circulating supply of Bitcoin. On the other hand, circulating supply can also be decreased via actions such as burning tokens, or mistakenly sending assets to addresses of other incompatible blockchains.
What is market capitalization?
Market capitalization is the result of multiplying the circulating supply of a certain asset by the asset’s current market value. For Bitcoin, the market capitalization at the beginning of August 2023 is above $570 billion, which is the result of the more than 19 million BTC in circulation multiplied by the Bitcoin price around $29,600.
What is trading volume?
Trading volume refers to the total number of tokens for a specific asset that has been transacted or exchanged between buyers and sellers within set trading hours, for example, 24 hours. It is used to gauge market sentiment, this metric combines all volumes on centralized exchanges and decentralized exchanges. Increasing trading volume often denotes the demand for a certain asset as more people are buying and selling the cryptocurrency.
What is funding rate?
Funding rates are a concept designed to encourage traders to take positions and ensure perpetual contract prices match spot markets. It defines a mechanism by exchanges to ensure that future prices and index prices periodic payments regularly converge. When the funding rate is positive, the price of the perpetual contract is higher than the mark price. This means traders who are bullish and have opened long positions pay traders who are in short positions. On the other hand, a negative funding rate means perpetual prices are below the mark price, and hence traders with short positions pay traders who have opened long positions.
Bitcoin price back to consolidation
Bitcoin (BTC) price has fallen back to its longstanding range bound movement, coiling up around the $25,824 level. Two outcomes are likely after such a move, a break north or south. Currently, the odds favor the downside and BTC could draw nearer to the $24,995 support level and extend the losses to the psychological $24,000.
In the dire case, Bitcoin price could dip into the demand zone between $21,711 and $20,155. This outlook draws inspiration from the Relative Strength Index (RSI), currently declining to show falling momentum. Similarly, the histogram bars of the Awesome Oscillator flash red to suggest a presence of bears in the market.
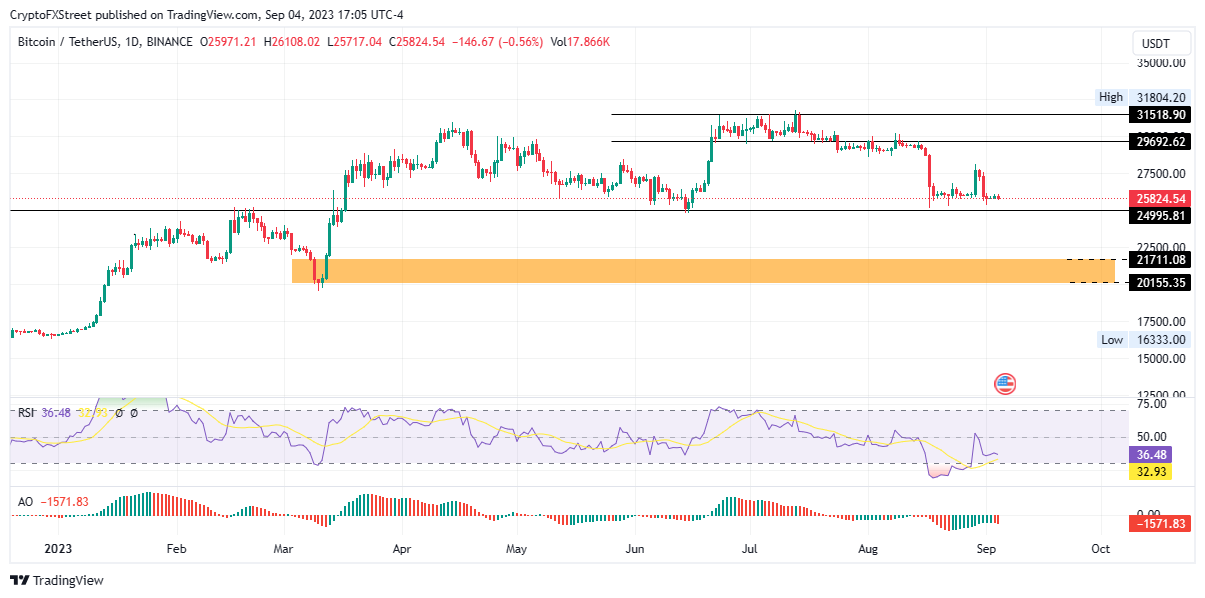
BTC/USDT 1-day chart
Conversely, a renaissance by the bulls could alter the impending fate for Bitcoin price, with a possible foray back above the psychological $28,000, level last tested on August 29. Increased buyer momentum could send the flagship crypto past the $29,692 barricade, or in a highly bullish case, shatter the $31,518 obstacle.
Also Read: Bitcoin investors expect more downside, Vitalik Buterin sells his MKR holdings
Ethereum price tests $1,630 support level
Ethereum (ETH) price is barely holding above the $1,630 support level, even as BTC shows weakness. Increased seller momentum could send the price lower, potentially breaching the $1,522 support level. A decisive flip of this buyer congestion level into resistance would solidify the downtrend for the short term and mark a 5% landslide.
Like BTC, the momentum indicators point to a similar outcome as momentum is steadily declining and the RSI could soon activate a signal to sell ETH when it crosses below the signal line (yellow band). Traders heeding this call would bode poorly for ETH.
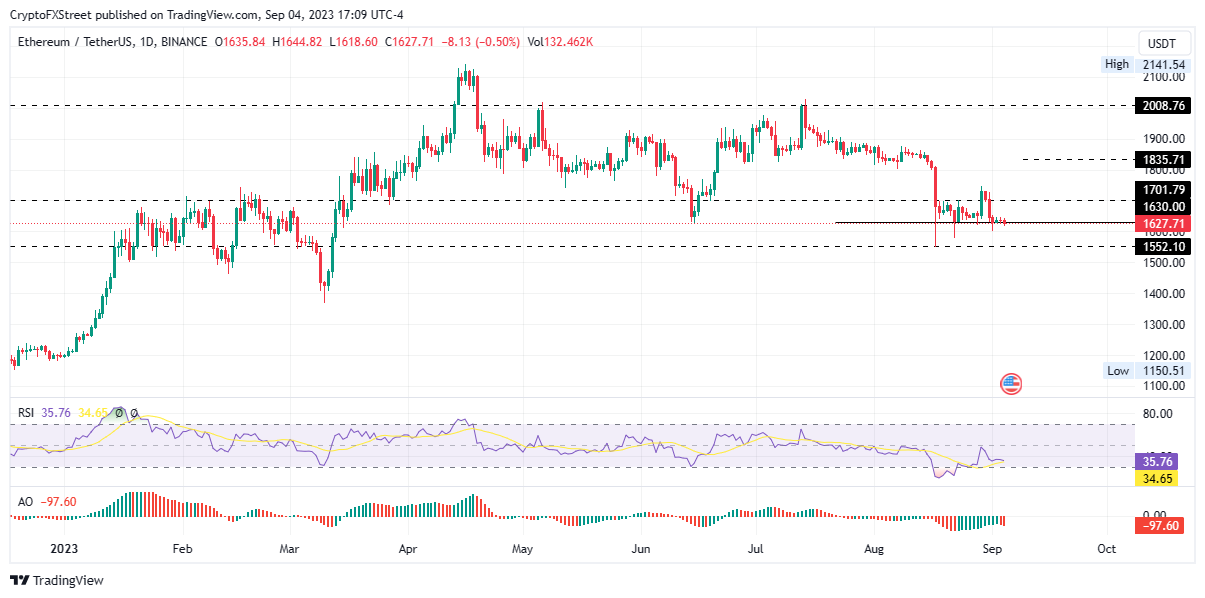
ETH/USDT 1-day chart
On the other hand, late or sidelined investors could salvage Ethereum price from the impending slump, with a possible move above the $1,701 resistance level. Increased buying pressure from this level could see ETH ascend to confront the mid-August highs around $1,835, or in the highly ambitious cases, attempt to break from current gloom by making a strong reach above $2,008.
Also Read: Ethereum Cancun upgrade development is on track, testing phase comes next
Ripple price goes AWOL
Ripple (XRP) price is nurturing a uptrend that could materialize if early profit takers keep their profit appetite in check. The token boasts three successive green candlesticks, pointing to bulls gaining ground.
Increased buying pressure could sustain the uptrend, sending Ripple price above the immediate hurdle at $0.5667, which stands as multi-month resistance level barring two equal highs and therefore significant.
Higher, Ripple price would have a shot at reclaiming the ground lost after the July 13 ascent, first breaching the $0.6840 level before taking back control with a solid move above the $0.8193 resistance level.
Noteworthy the RSI had executed a bullish crossover, moving above the signal line in an attempt to siren a buy signal. Traders harkening to this call could enhance the uptrend for Ripple price. The AO makes the bullish outlook stronger, with the histogram bars soaking in green and edging toward the midline. This adds credence to the bullish outlook.
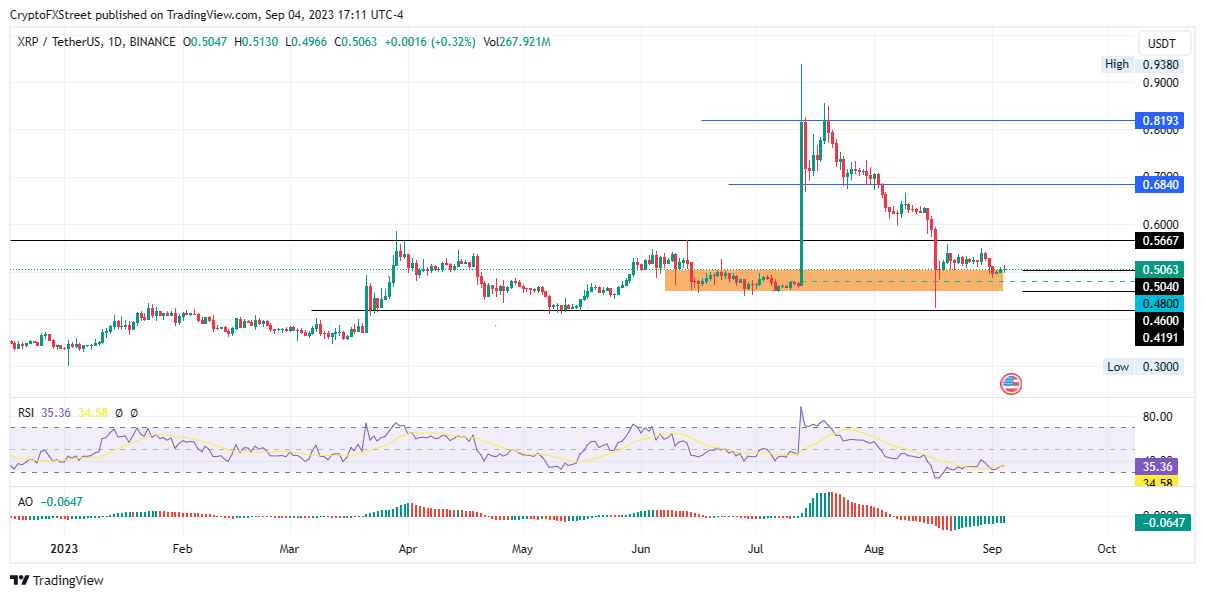
XRP/USDT 1-day chart
On the other side, early profit takers from XRP holders who are incurring losses at current price or breaking even and looking for early exits to escape losses could sell the remittance token, so much so that the demand zone between $0.5040 and $0.4600 fails to hold as support. A decisive break below the mean threshold (midline of demand zone marked in blue) would invalidate the bullish thesis, exposing XRP to an extrapolated slump toward the $0.4191 support level.
Breaking: Ripple files opposition to SEC’s motion to certify interlocutory appeal
Author

Lockridge Okoth
FXStreet
Lockridge is a believer in the transformative power of crypto and the blockchain industry.


