TOP 3 price prediction Bitcoin, Ethereum, Ripple: Optimal technical pullback to test the new Yahoo Finance service
- BTC/USD follows the script and moves back, with a target price level of $6,890.
- ETH/USD also enters correction mode, reaching theoretical target at $284.
- XRP/USD accompanies the correction and reaches a mid-point on its way to the $0.32 price level.

We're excited to hear about Yahoo Finance's new service that allows you to buy Cryptocurrencies directly from their financial information page. It is surprising that there are multiple problems and doubts to approve the launch of ETFs on Cryptos but that there is no problem in buying them directly on one of the largest platforms in the world.
The technical study told us yesterday that the main assets of the Crypto board were most likely to enter a consolidation phase and we are already in that scenario.
The most remarkable thing of the day, from a technical point of view, is the phase of development of the corrective pattern in each of the three main cryptocurrencies.
The thing that strikes me is that it seems that Ethereum has consumed the phases very quickly and is already at a key point where ETH/USD could be turned upwards well in advance of what the BTC/USD is likely to do. It is only a possible scenario for ETH/BTC. The other scenario, the opposite, proposes another bearish leg for ETH/USD. And Ethereum does not have much margin for downward movement without critically damaging its technical outlook.
BTC/USD 240-Min
Bitcoin is trading against the Dollar at the $6,971 price level, still halfway to the target of the retracement which is at the bullish trend line won earlier this week. BTC/USD can have an extension to confirm the SMA200 from the upside. The target price level is $6,890, and right now the SMA200 is moving at the $6,847 price level.
Above the current price, BTC/USD has as its main target the price level of $7,117 (relative highs). From this level on, Bitcoin should jump forward to $7,400 (price congestion resistance) and so on with the following resistance levels at $7,600 (price congestion resistance), $7,730 (price congestion resistance) and $7,860 (price congestion resistance). The target for this second upward leg would be at the price level of $8,700 - $9,000.
Below the current price, the target for BTC/USD in this corrective tranche at $6,890 (trend line). The scenario would also accept an extension through the level where the SMA200 passes at $6,847 (moving average). In this case, the relevant input would be the closing level of the candlestick, which should be above the price level of $6,900 (trend line).
In any case, if Bitcoin loses this last support, next support in the price level of $6,770 (moving average and price congestion support) and further down in the price level of $6,600 (moving average and price congestion support).
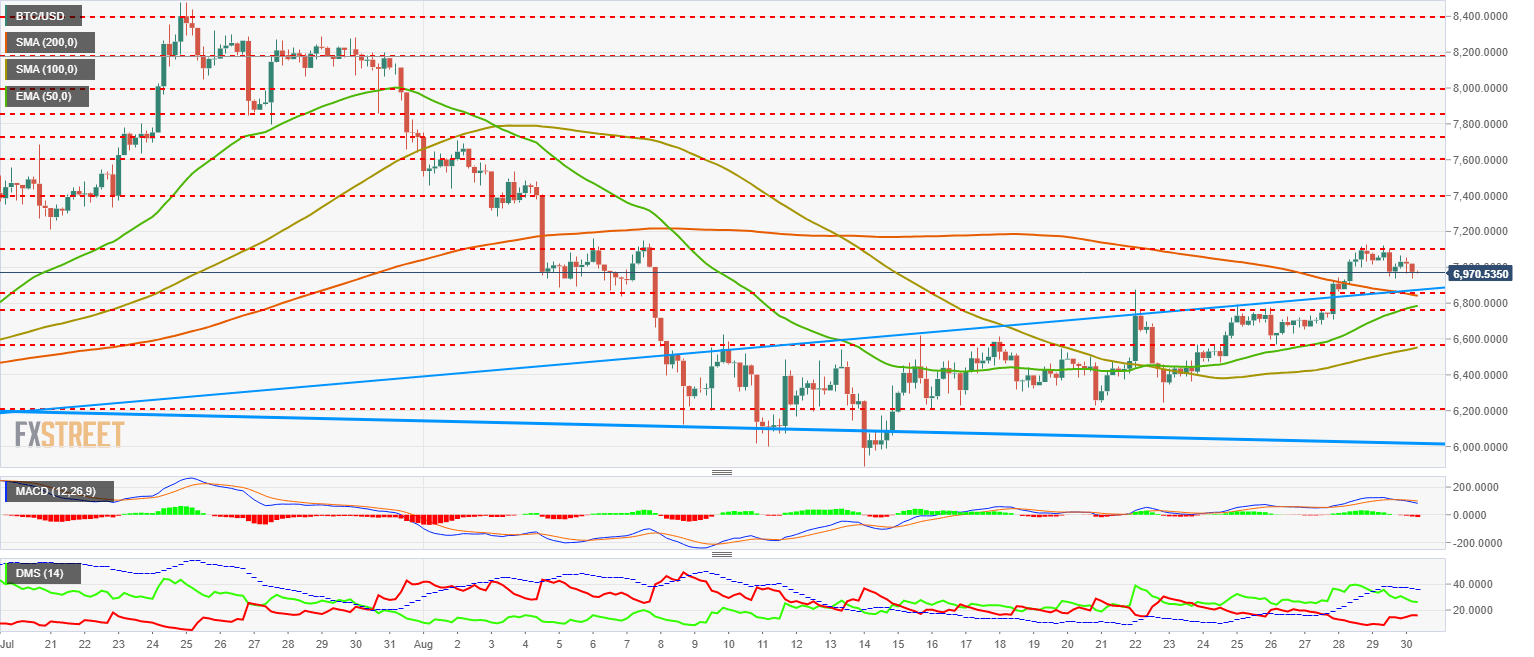
The MACD at 240-Min is crossed downwards and has enough room to develop to the short side. The most likely pattern is one of slow consolidation with mild price declines.
The DMI at 240-Min shows buyers decreasing positions while sellers increase them, albeit far from important levels. The trend force, indicated by the ADX, is slightly decreasing but still at fairly high levels.
ETH/USD 240-Min
Ethereum is trading against the Dollar at the price level of $282.87. This is just above the SMA100 and EMA50, important moving averages that could give ETH/USD good support.
As I mentioned in the introduction to this analysis, the technical development of ETH/USD is more advanced than in the case of BTC/USD. The clearest point of this situation is seen in the MACD and DMI indicators below.
Above the current price, ETH/USD has a clear first resistance at $290 (price congestion resistance) followed by $305 (price congestion resistance) and $317 (price congestion resistance). The bullish target for this second tranche is, in the case of ETH/USD, the $460 (trend line) level.
Below the current price, ETH/USD only has two clear stands before rolling down the mountain, the first at $270 (price congestion support) and the second at $260 (price congestion support).
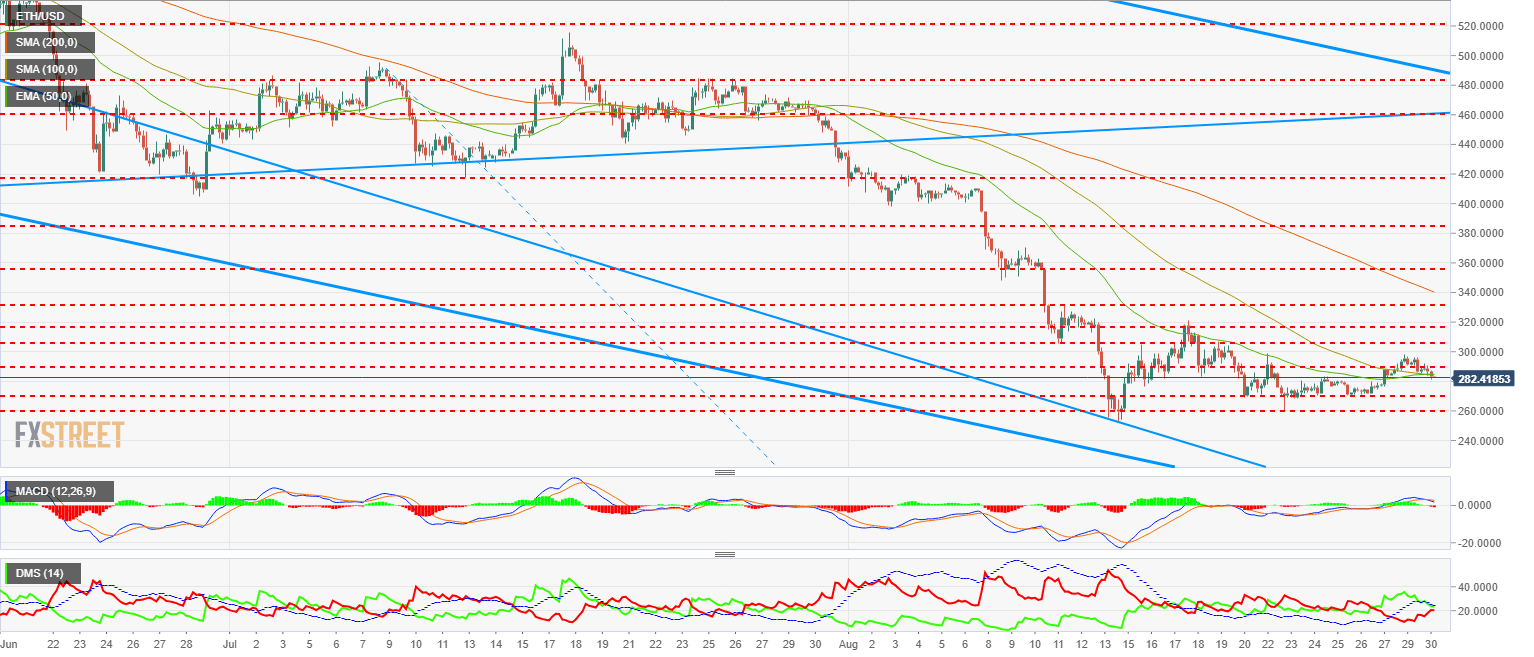
The MACD at 240-Min is crossed upwards but is now close to the 0 level that would exert the support role. This situation may lead to the emergence of bullish reversals in the near future. A few days ago, I showed you a graph of the ETH/BTC cross hinting a change in the relative behavior of Ethereum vs Bitcoin could happen shortly. In this detail of the MACD, we can see a similar sign, although still premature.
The DMI at 240-Min shows buyers and sellers almost even, with a slight advantage for the bulls. This is also an indicator that a possible turn is imminent.
XRP/USD 240-Min
XRP/USD is currently trading at $0.330, with a resumption of the corrective movement that started yesterday during the American session. Technically, it is the pair that shows the most fragility at the moment.
Above the current price, XRP/USD has a resistance at $0.345 (price congestion resistance) followed by others at $0.360 (EMA50) and at $0.368 (price congestion resistance). The target for a second bullish tranche is set at the $0.45 price level (trend line).
Below the current price, first support at $0.32 (SMA100 and price congestion support) followed by $0.296 (price congestion support). Finally, support at $0.257 (relative minimum and support for price congestion).
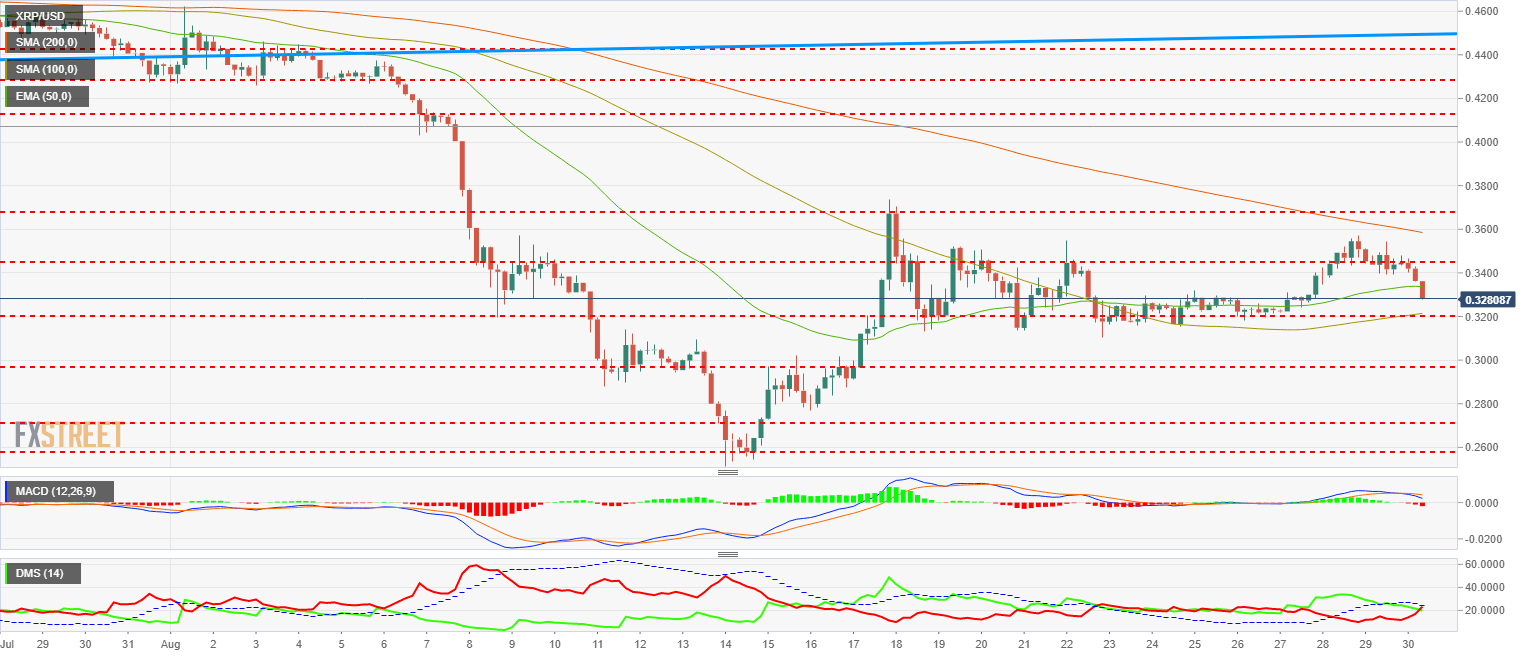
The MACD at 240-Min is shown crossed down, with very little space from the level 0 of the indicator. That doesn't leave much room for bearish movement.
The DMI at 240-Min shows buyers and sellers very evenly matched, with a slight advantage for bears. The level of intensity in both is low and the ADX shows no clear strength in either direction either. Possible slow consolidation scenario at levels of $0.30-$0.32.
Author

Tomas Salles
FXStreet
Tomàs Sallés was born in Barcelona in 1972, he is a certified technical analyst after having completing specialized courses in Spain and Switzerland. He expanded his technical training following the guidance of great experts on the financial markets.



