TOP 3 price prediction Bitcoin, Ethereum, Ripple: Intangible Asset Value vs Market Price
- BTC/USD begins consolidation of key levels with a possible target price level of $6,890.
- ETH/USD still unable to show the strength that a Top 2 Crypto is supposed to have.
- XRP/USD does not breach the SMA200, possible consolidation in SMA100 at the price of $0.331.

After the initial bullish momentum of the last few days, my first idea is that the market is putting a price on the value of Bitcoin's intangibles. The difference in the price ranges and technical structure of BTC/USD compared to ETH/USD or XRP/USD leads me to believe that factors such as "Safe Value" or "Safety" are being transferred to price and that this movement is focusing on Bitcoin above any other Cryptocurrency.
We wake up this Wednesday in Europe with consolidation movements in the main Cryptos of the board. It is worth highlighting EOS's performance, which continues to recover strongly from its lows and is currently trading at the $5.91 price level. The target of this move for the EOS/USD is at the price level of $6.728. Reaching this level would close the gap left last August 8th.
It’s also interesting to comment on the ETH/BTC relationship in the medium term. It is very likely that Ethereum will begin to do better than Bitcoin in the first half of September, a setup that could continue for a few weeks. However, in the long term, the pair's technical analysis is severely degraded on the Ethereum side, and it is likely that after this positive phase, its relative value against Bitcoin will fall. It could be because Bitcoin is booming or because the market is turning its back on Ethereum.
BTC/USD 240-Min
BTC/USD is currently moving at the price level of $7,044 after finding a brake at the price level of $7,100 (Congestion Resistance). Now, BTC/USD's living space is above the most important moving averages, which should now play their role as supports.
For the next few hours, we can expect consolidation movements after several days of significant increases and very significant technical achievements. Healthy behavior should take the price to the very edge of the bullish trend line that now frames the scenario. The SMA200 in 4H is about to cross this trend downwards but should not move any further downwards and the most desirable thing would be to wait in this price area for the arrival of the SMA100 and the EMA50.
Above the current price, BTC/USD has the price level of $7,100 (Congestion Resistance) as its first target. From this level on, the bullish continuity demands a jump to the price level of $7,400 (Price Congestion Resistance). Above $7,400, six resistance levels up to the key $8,400 area, which will tell us if this is a medium or long-term move.
Below the current price, the objective of a likely consolidation is at the price level of $6,928, with a good chance that the SMA200 will play even if it is below the trend line. In this case, the movement of BTC/USD would be fast and closing above the line.
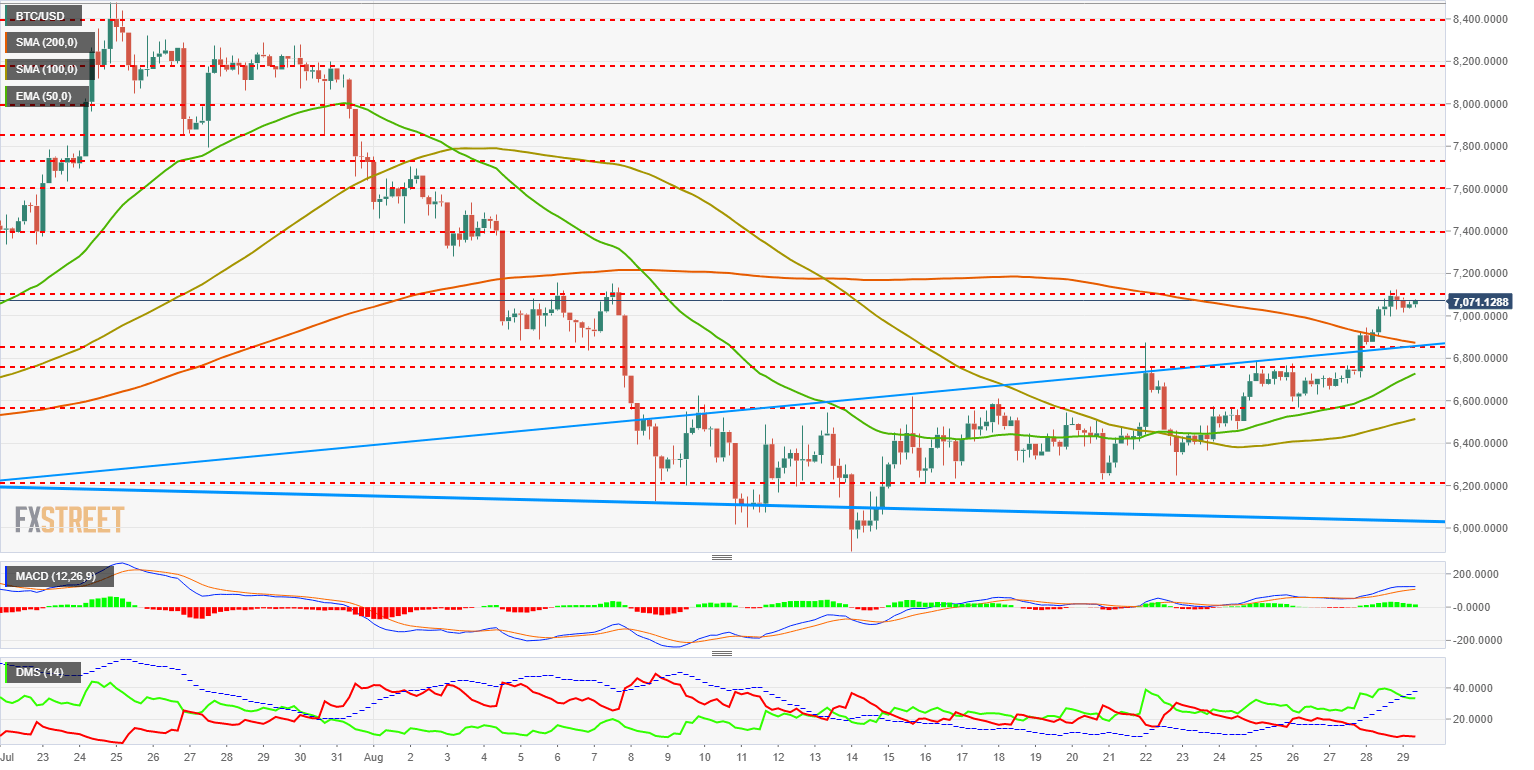
MACD at 240-Min loses momentum and acquires a more horizontal profile. The pattern gives room for a continued bullish trend, although development is already advanced and a correction in BTC/USD is likely to be beneficial as well in the medium term.
The DMI at 240-Min shows how the buyers are below the ADX, losing some strength after the high levels reached. Sellers are not reacting to the pause in upward development and remain at very low levels.
ETH/USD 240-Min
As I said in the headline of this article, I have serious doubts about ETH/USD. The chart drawn by Ethereum is not the one expected from a leading player in any bullish market. This situation can always change in minutes, but for now that is the impression I have.
Above the current price, there are three levels of price congestion resistance at the levels of $305, $317 and $330. Above the latter price level, the next resistance will be the SMA200, which is currently moving at the $345 price level.
Below the current price, the first support just below at the $289 price level. If ETH/USD loses this level, second fragile support at $280 (round number) and a third support, in this case a strong support, at the price level of $270 (Price Congestion Support). Underneath this last support, Ethereum could enter a world of pain.
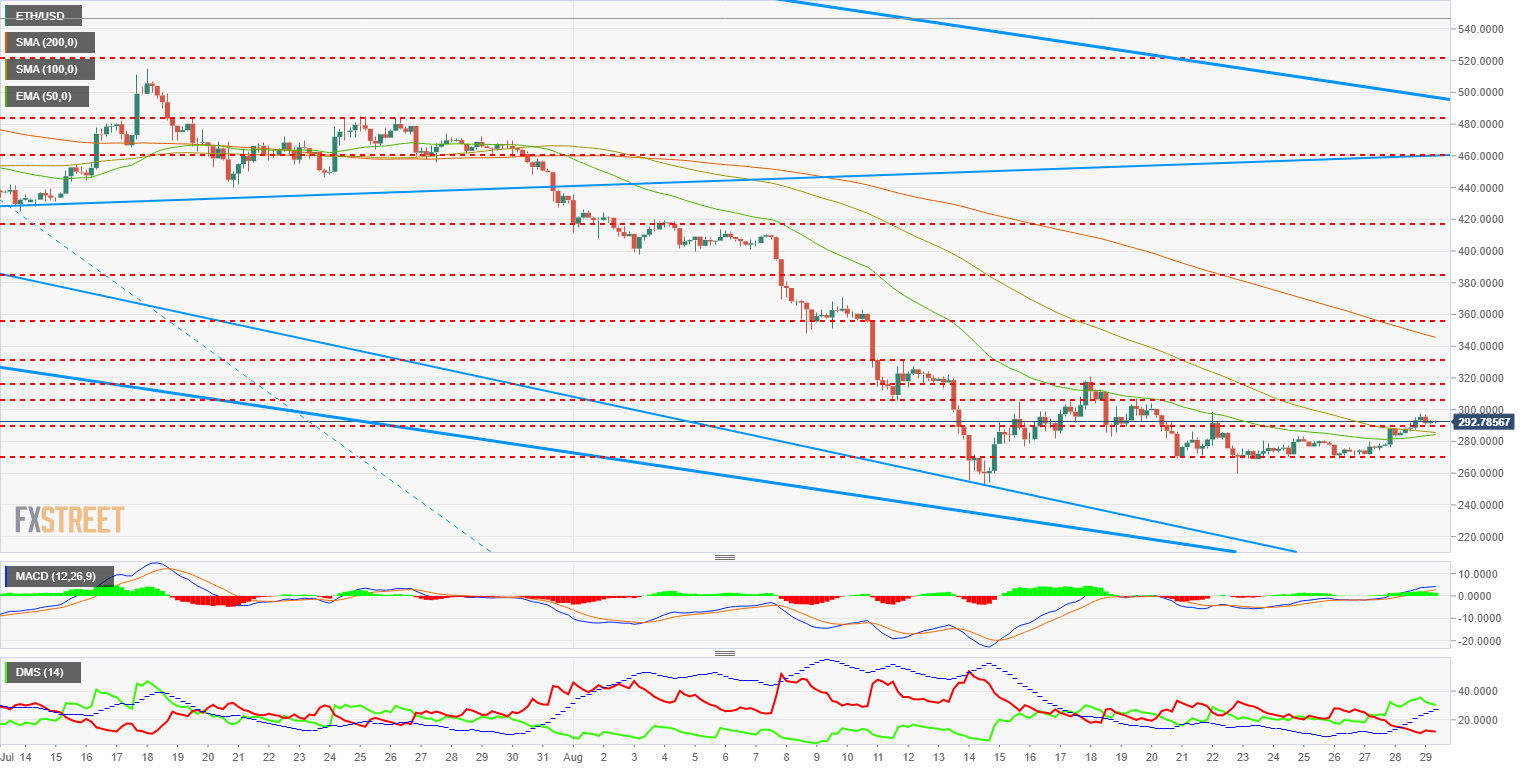
The MACD at 240-Min shows a profile with a good bullish slope but with a short distance between the lines. It proposes an open scenario where both an upward trend and a consolidation process are possible.
The DMI at 240-Min shows buyers losing some strength and staying above the ADX line. Sellers, on the other hand, may increase their activity level somewhat, but without reaching dangerous levels for the bullish trend.
XRP/USD 240-Min
XRP/USD is currently trading at the price level of $0.345, just above the support level of $0.344 (Price Congestion Support). It is enclosed between the SMA100 and the EMA50 on the bracket side and the SMA200 on the resistor side.
Solving this scenario is vital for XRP/USD, as it will define the behavior in the medium term.
Above the current price, first resistance at the price level of $0.36 (SMA200). If it manages to breach this moving average, the next resistance is at the price level of 0.368. From this level, it will need a jump movement to the next resistance at the price level of $0.413.
Below the current price, we find at first a support at the price level of $0.331 (EMA50). In the event of a collapse of this support, the next price level would be $0.320 (SMA100 and Congestion Pricing Support). If the latter level were to be lost, it would be very worrying for the bulls, but in any case, next support is at the price level of $0.296 (Price Congestion Support).
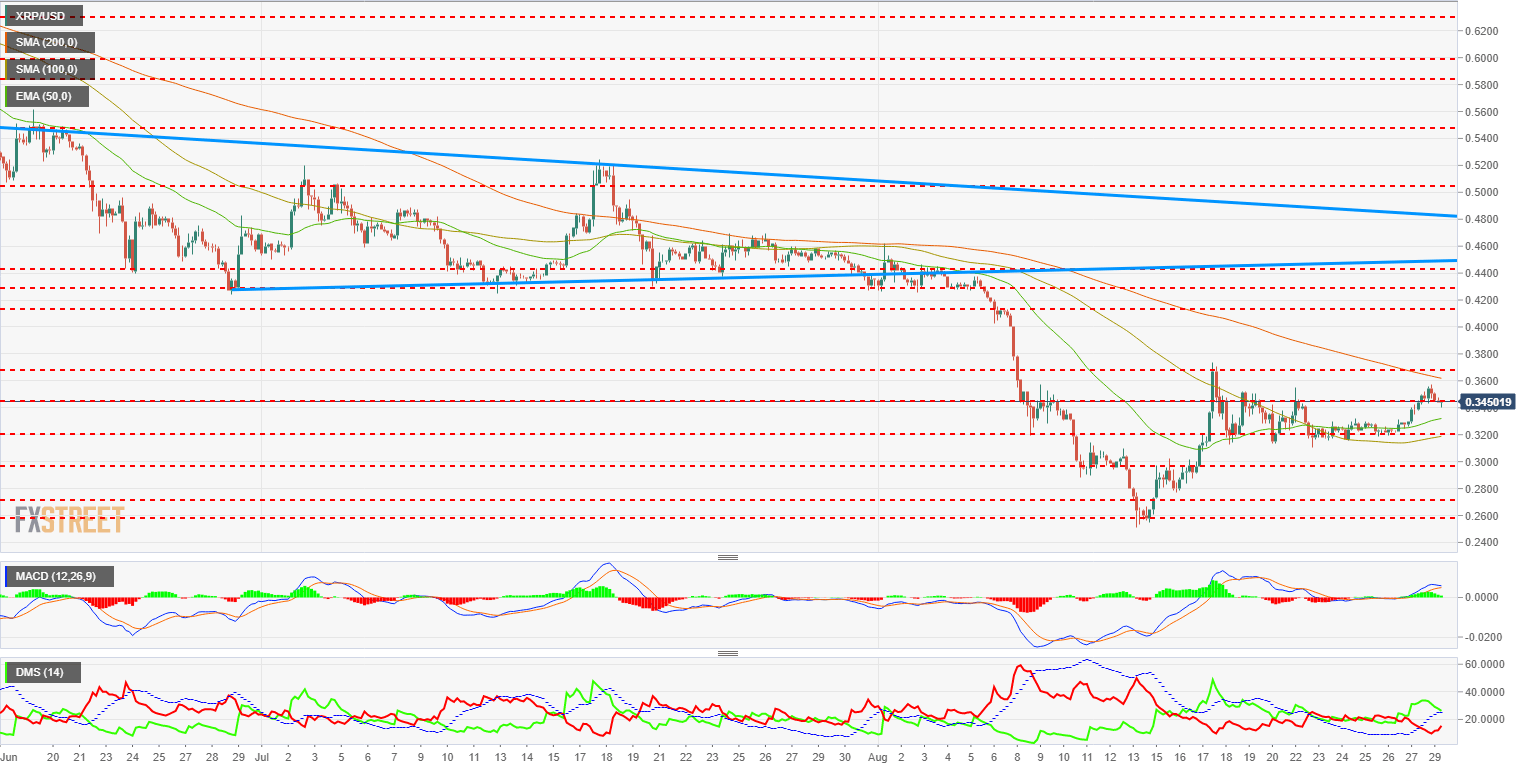
The MACD at 240-Min shows a profile with a slight downward slope. Upward movement is likely as a rebound prior to a downward line cut.
The DMI at 240-Min shows some buyers clearly decreasing their activity level, while the sellers react strongly to Ripple's doubts.
Author

Tomas Salles
FXStreet
Tomàs Sallés was born in Barcelona in 1972, he is a certified technical analyst after having completing specialized courses in Spain and Switzerland. He expanded his technical training following the guidance of great experts on the financial markets.



