Top 3 Price Prediction Bitcoin, Ethereum, Ripple: JPMorgan warns of BTC bear market as backwardation mirrors 2018
- Bitcoin price bounces almost 25% from the June 8 low, lifting it near-critical resistance.
- Ethereum price fails to build off the June 8 intra-day rebound, sidestepping BTC bullish sentiment.
- XRP price remains locked between the psychologically important $1.00 and the crucial $.0780 support.

Bitcoin price closed yesterday up 11.98%, the largest daily return since February 8 when it broke out from a multi-week cup base. Ethereum price continues to hover below the 50-day simple moving average (SMA) with no convincing price action to forecast a better outlook for the smart contracts giant. XRP price cultivates no price traction after triggering a bullish hammer candlestick pattern.
Financial stability concerns yield demanding capital requirements for cryptos
On Thursday, the Basel Committee on Banking Supervision said that the financial industry, particularly the banking sector faces heightened risks from digital assets because of the outsized potential for money laundering, reputational challenges and simple wild price swings that could lead to defaults. The committee said that “the growth of cryptoassets and related services has the potential to raise financial stability concerns and increase risks faced by banks.”
The panel proposes that a 1,250% risk weight be applied to a financial institution’s exposure to Bitcoin and other cryptocurrencies. It means that a bank will need to hold a dollar in capital for each dollar worth of Bitcoin. The capital needs to be sufficient to withstand a complete write-off of the digital asset exposure without harming depositors.
The capital will be sufficient to absorb a full write-off of the cryptoasset exposures without exposing depositors and other senior creditors of the banks to a loss.
The proposal will not take effect immediately, and due to the early stage of the cryptocurrency complex, the initial policies will likely change as the market develops. No clear timeline was put forward, so due to the usually lengthy process of agreement and implementation of Basel rules, the proposal will not come into effect for several years.
Bitcoin price bounce has not allayed doubts about its vulnerability
JPMorgan strategist Nikolaos Panigirtzoglou penned a note that revealed backwardation in recent weeks as a negative dynamic for Bitcoin price and may be pointing to a bear market. Backwardation occurs when the current price of an underlying asset is higher than prices trading in the futures market. Traders capitalize on backwardation by selling short at the current market price and buying at the lower futures price.
In the note, JPMorgan cited 2018 as an example of when backwardation occurred, a year when Bitcoin price fell 74%. The backwardation condition is an unusual development, but it is a sign of weak demand for Bitcoin from institutional investors.
The investment note also cited the notable decline in BTC’s share of the overall crypto market, currently at 42% and down 70% from the start of 2021, as a concern. It is a sign that retail investor’s crypto-enthusiasm was spreading to altcoins, signaling a bubble.
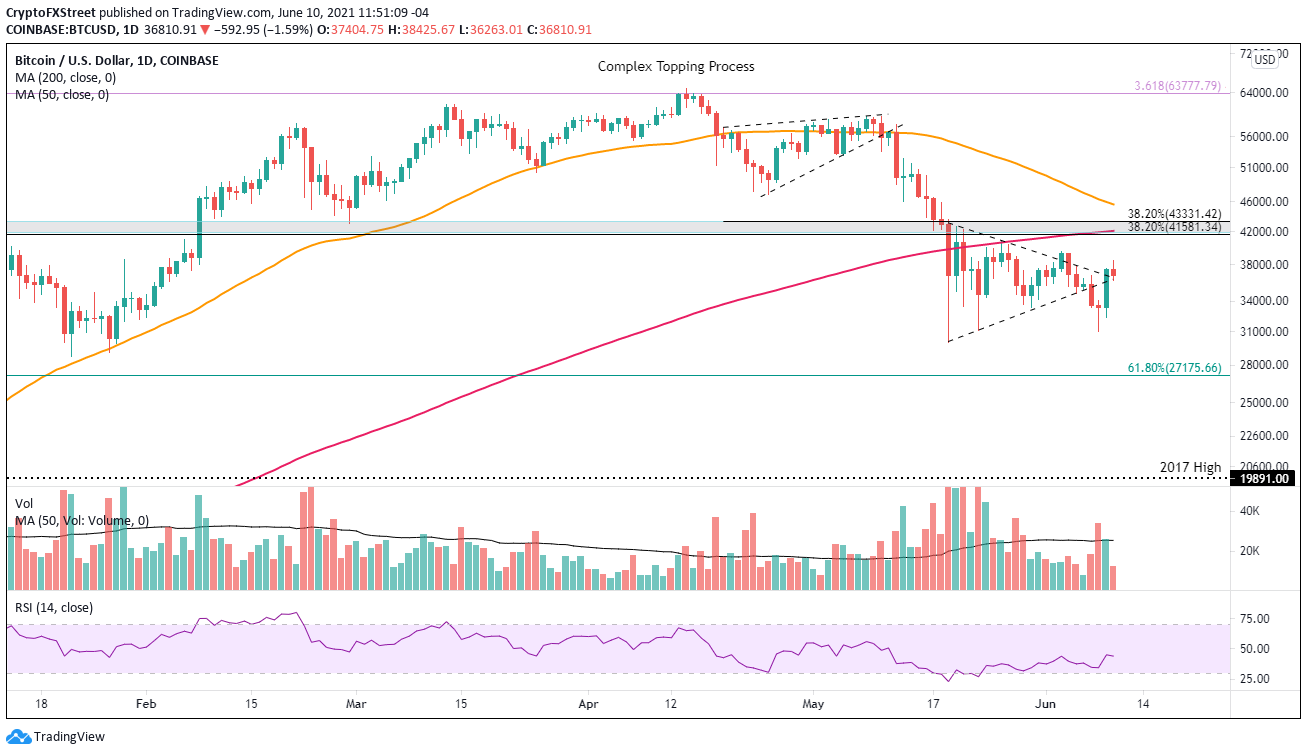
Despite the 25% rebound, nothing has materially changed for Bitcoin price. The $30,000 price level defense on June 8 solidified a 10,000 point trading range for the bellwether cryptocurrency in the near future. Only a daily close below $30,000 or a daily close above $43,331 will release BTC from the volatility.
Upside resistance still rests at the confluence of the 38.2% retracement of the rally from the March 2020 low at $41,581, the January 8 high at $41,986, the February 28 low at $43,016 and the 38.2% retracement of the April-May decline at $43,331.
It is important to note that Bitcoin price is on pace to register a death cross on the daily chart in less than a week.
BTC/USD daily chart
Downside support begins with the price area between the May 23 low at $31,111 and the May 19 low at $30,000. Secondary support is the 61.8% retracement of the March 2020 rally into April at $27,175.
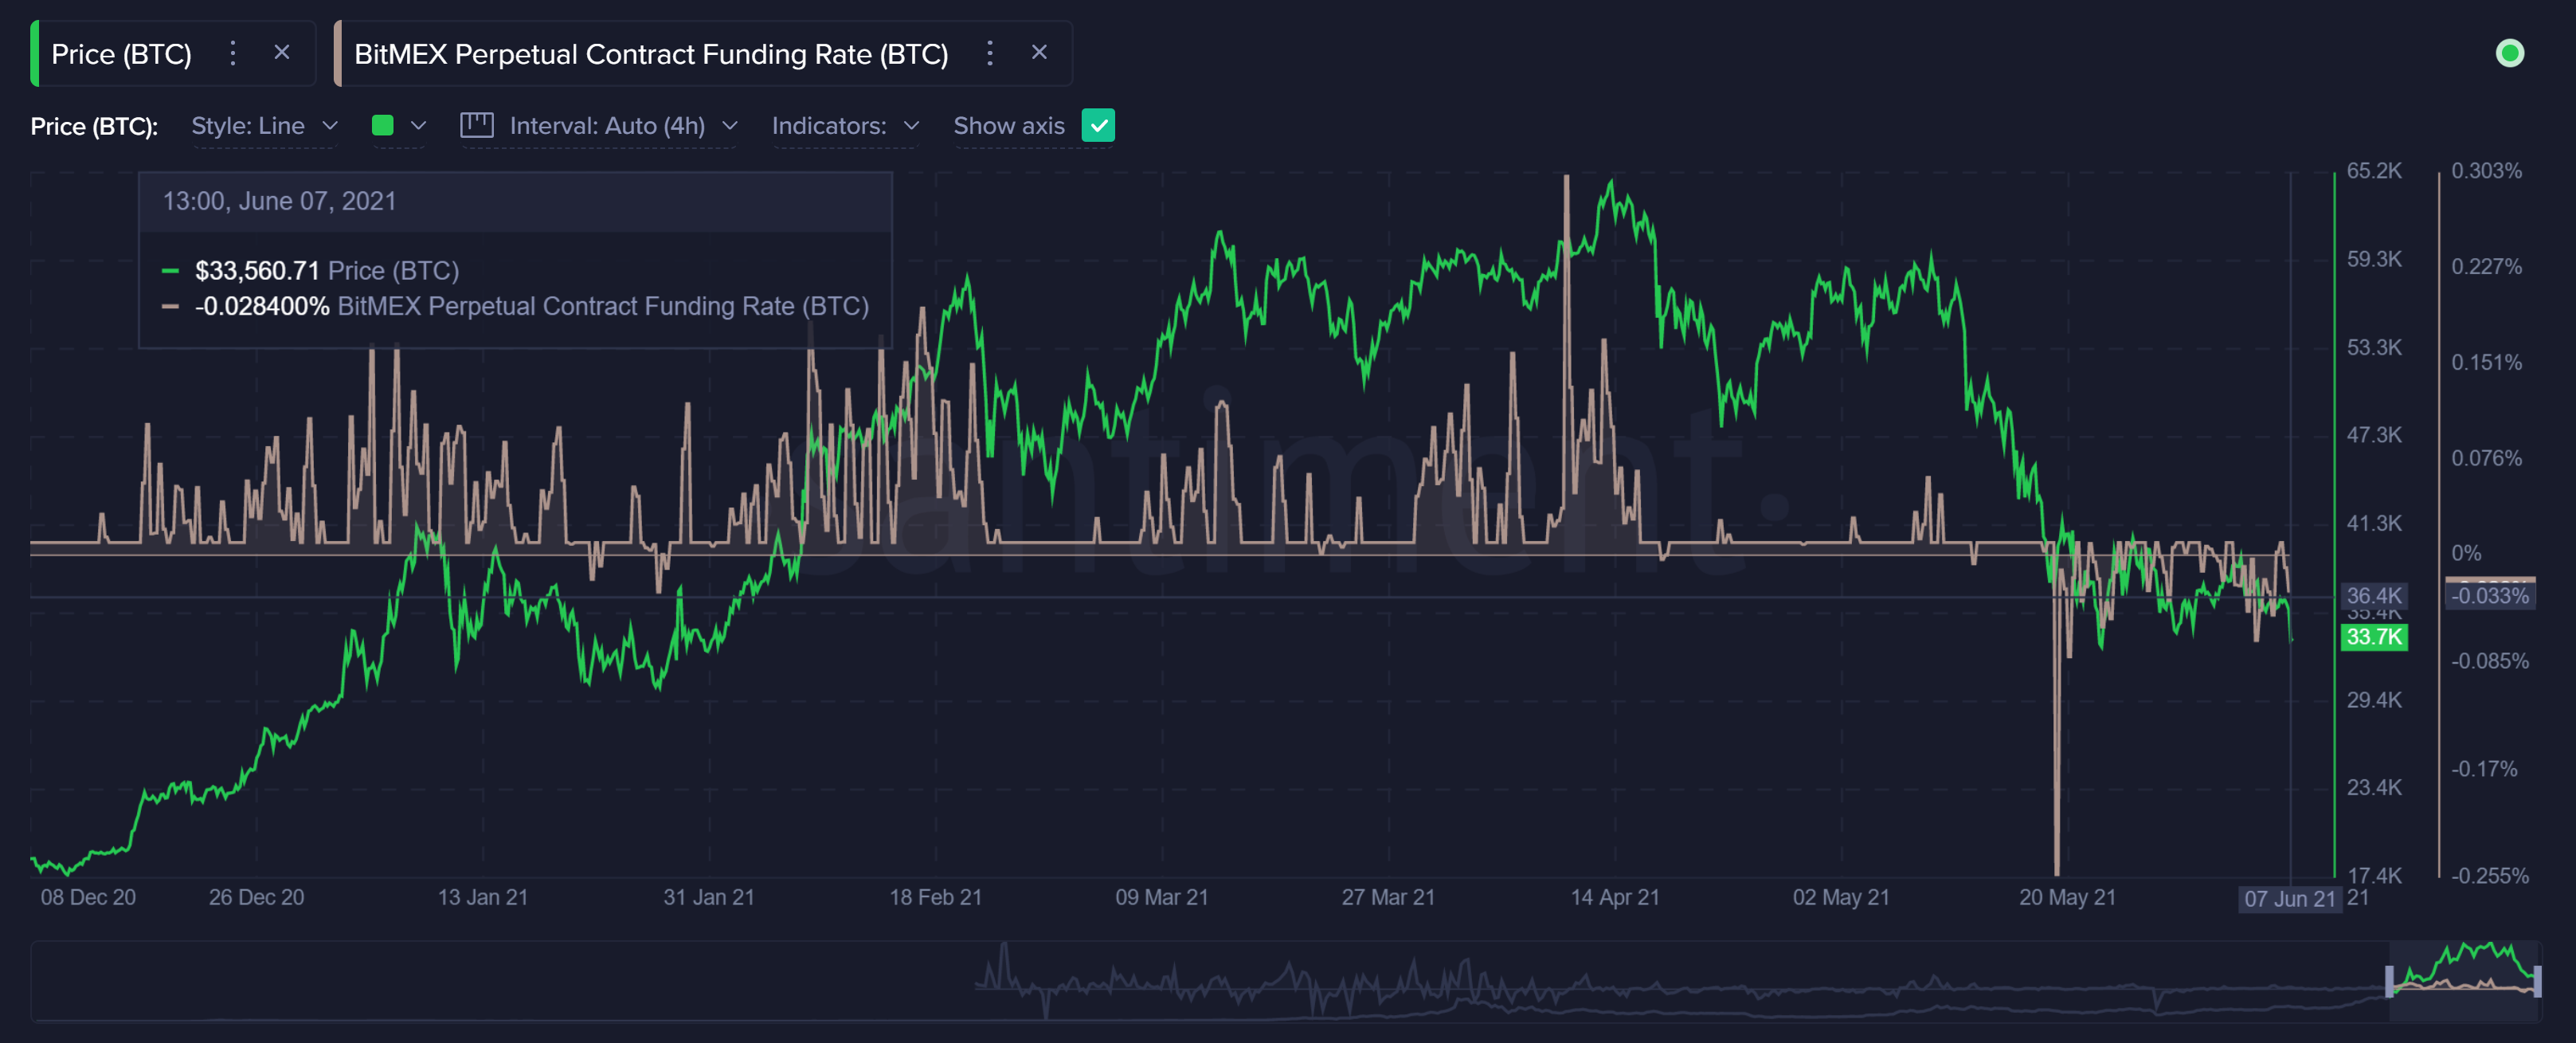
Supporting a bearish outlook for Bitcoin price is Bitmex’s Perpetual Contract Funding Rate. It has been negative, indicating growth in short positions. However, it must be pointed out that when groupthink reaches an extreme, as the funding rate may infer, it is an opportunity to buy into the fear. It could have been the reason for the considerable rebound from the June 8 low.
BTC Bitmex Perpetual Contract Funding Rate - Santiment
Ethereum price sentiment still reveals a bearish tilt for the digital token
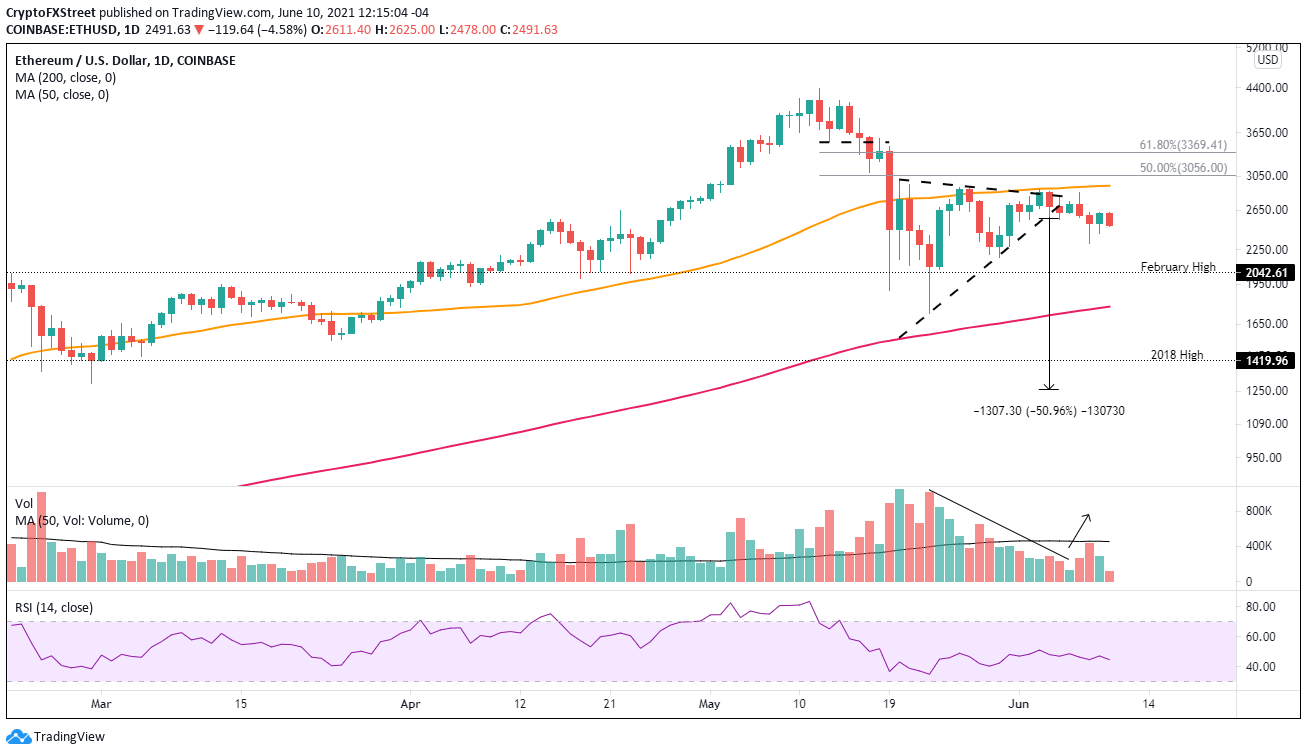
Ethereum price defined a bearish pennant pattern that initially released on June 3, but it was quickly met with notable resistance at the 50-day SMA at $2,895. On June 4, ETH reversed lower and by June 5 was below the pennant’s lower trend line on a closing basis, which followed through with a decline into June 8.
The measured move target of the symmetrical triangle is $1,257, yielding a 51% decline from the position of the lower trend line on June 4.
To achieve the extreme price target, Ethereum price needs to overcome support at the May 30 low at $2,647, the May 23 low at $1,728, the 200-day SMA at $1,616 and eventually the 2018 high at $1,419.
ETH/USD daily chart
If Ethereum can register a daily close above $2,849, the outlook snaps to neutral for ETH investors and places the cryptocurrency on the path to stabilization.
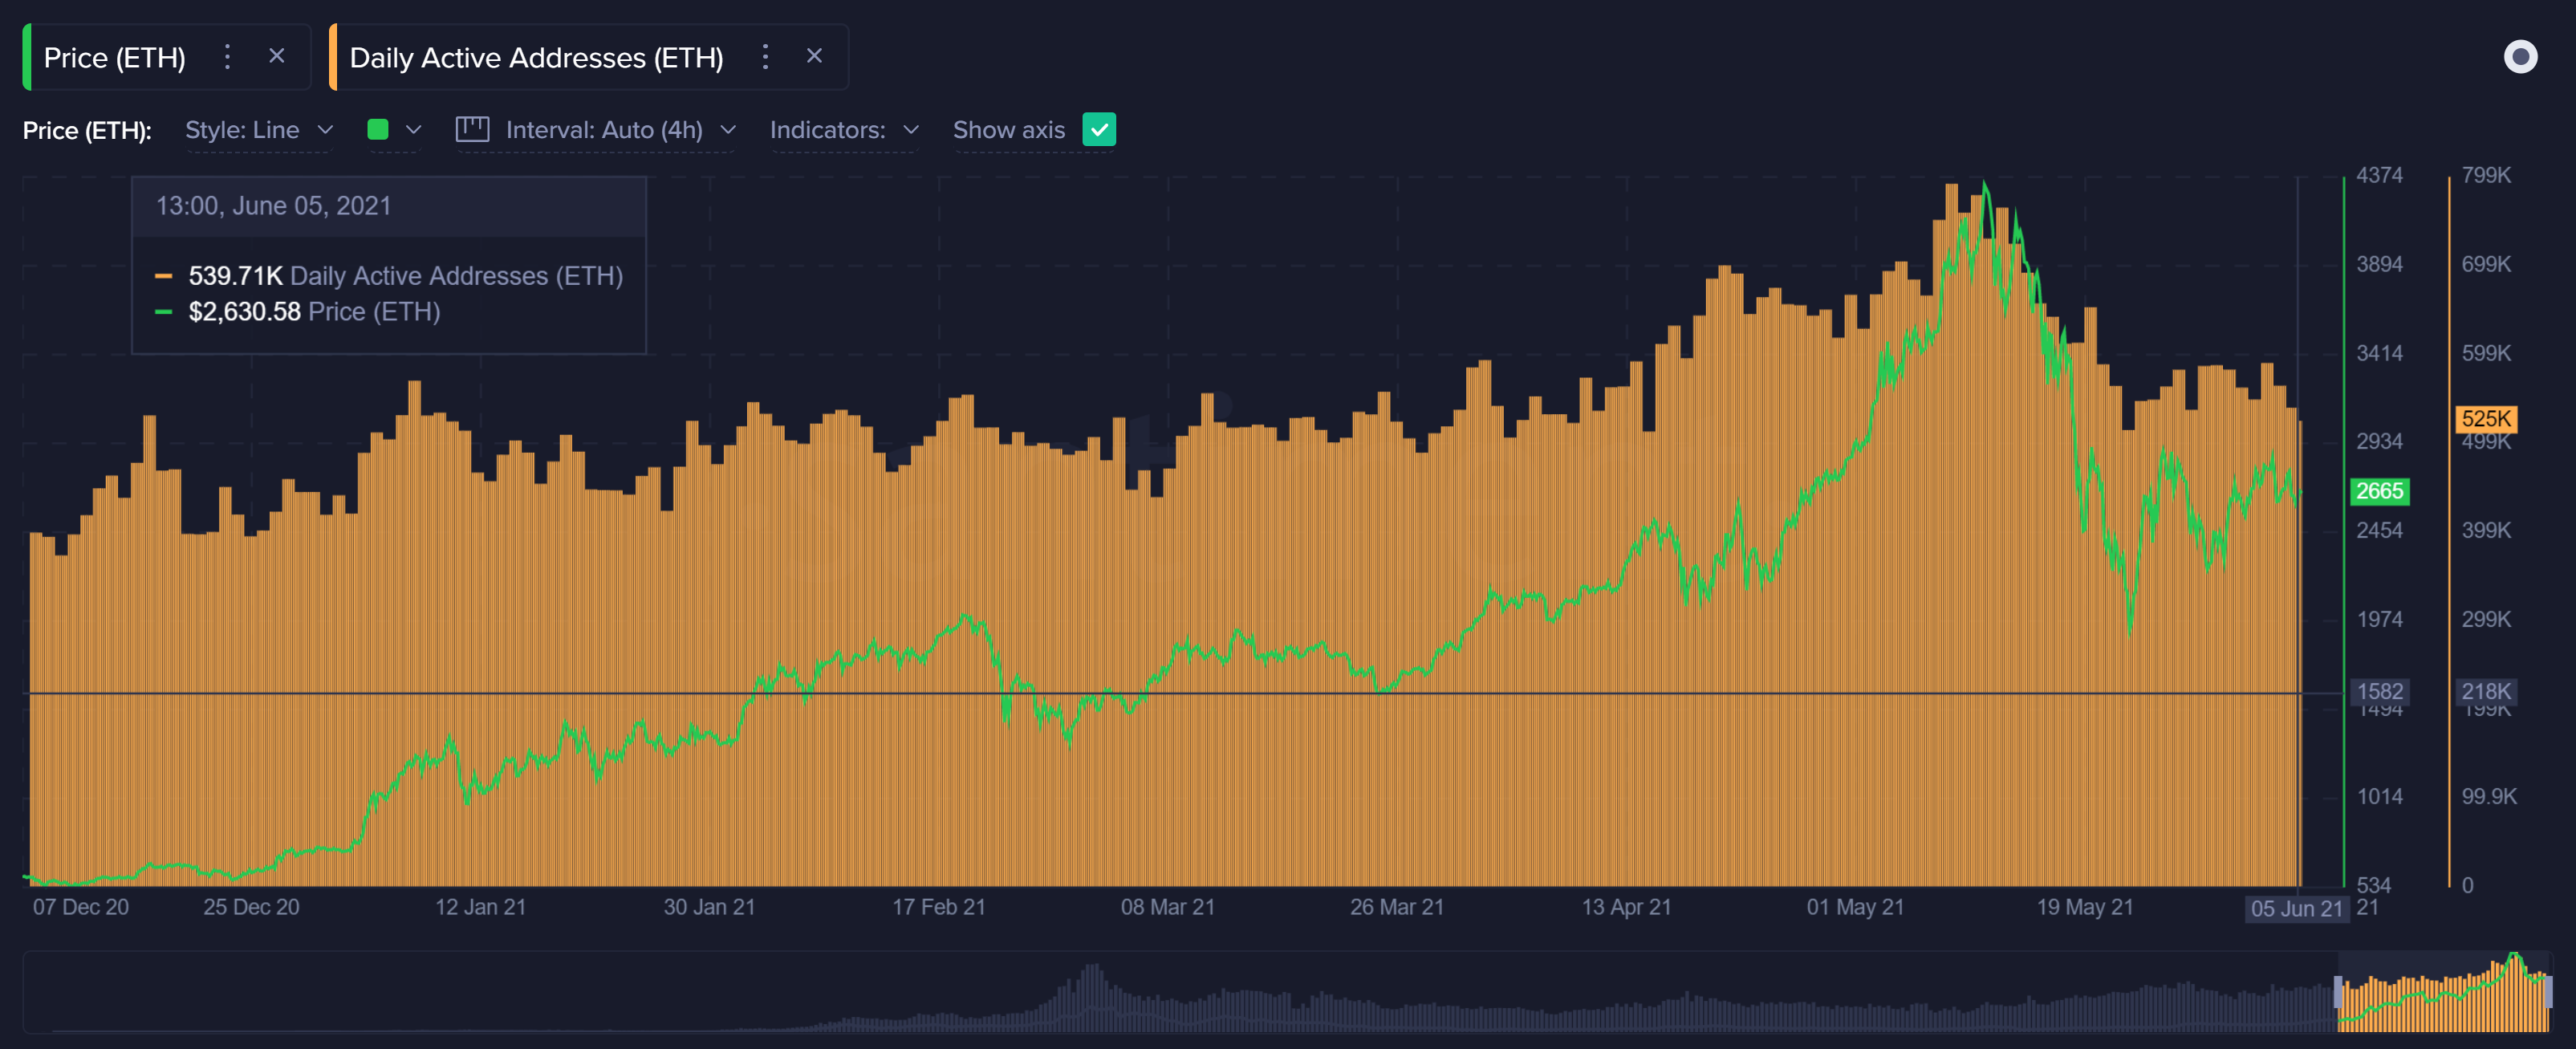
Supportive of the short-term bearish outlook is the daily active addresses metric. It has been declining since May’s all-time high. Although it has not matched the same sudden drop as Bitcoin, this lack of address interaction is a concern.
ETH Daily Active Addresses - Santiment
XRP price action still not looking good for investors
XRP price formed a bearish flag pattern following the June 23 low that resolved to the downside on June 5. Ripple declined into the critical $0.780 support on June 8 before staging nearly a 20% rebound and triggering a bullish hammer candlestick pattern formed on June 8.
The measured move target of the Ripple bear flag pattern is $0.432, rewarding stubborn investors a 53% loss from the June 5 breakdown. The measured move is calculated using the flagpole preceding the flag construction. It would be an immense blow to the narrative projecting a new all-time in 2021.
As long as XRP price holds $0.780, the outlook remains neutral with a slight bullish tilt, but a failure to hold exposes Ripple to test 200-day SMA at $0.717 and then the May 23 low at $0.652. Any weakness beyond that those levels will put the measured move target in the crosshairs.
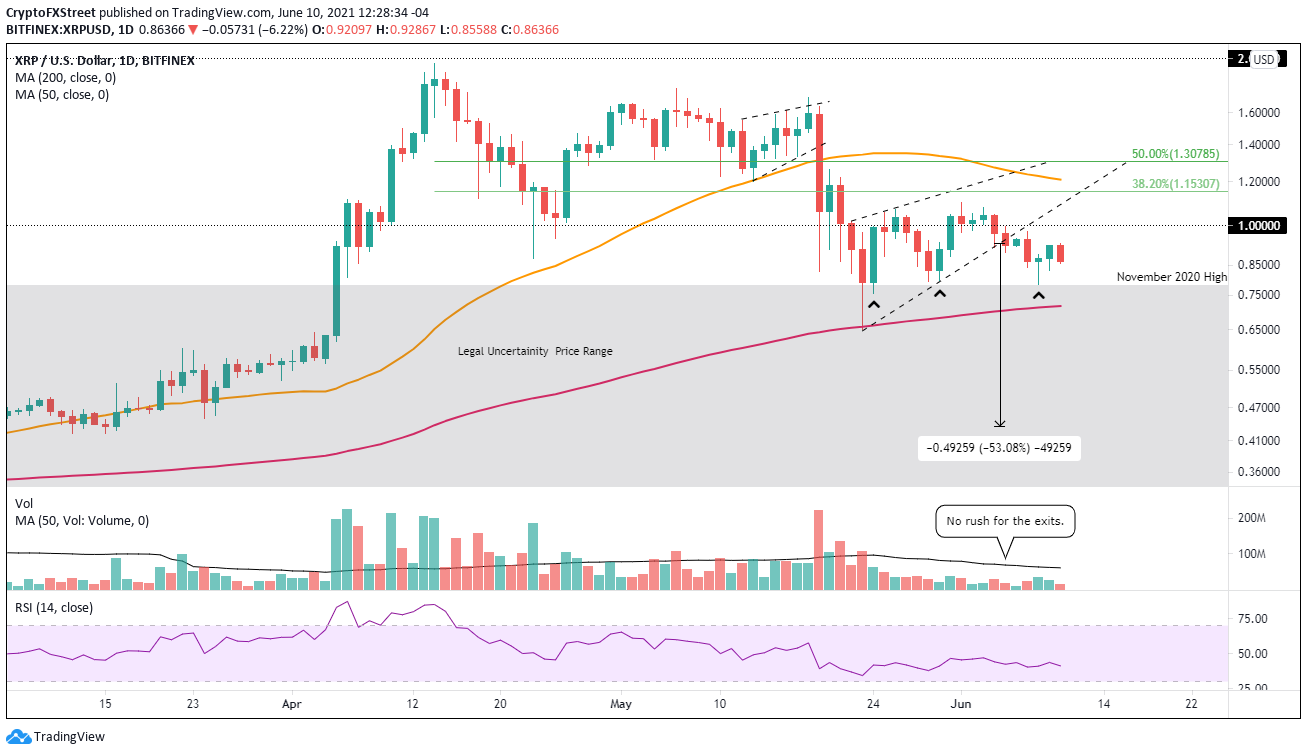
XRP/USD daily chart
A daily close above the psychologically important $1.00 on a daily basis will be a reversal of fortune for Ripple investors.
Author

Sheldon McIntyre, CMT
Independent Analyst
Sheldon has 24 years of investment experience holding various positions in companies based in the United States and Chile. His core competencies include BRIC and G-10 equity markets, swing and position trading and technical analysis.



