Top 3 Price Prediction Bitcoin, Ethereum, Ripple: ETH trades like a zombie as BTC and XRP sprint higher
- Bitcoin price could still be formalizing the right shoulder of a head-and-shoulders topping pattern.
- Ethereum price rewinds minor gains, trading below the 200-day SMA again.
- XRP price rebound looks vulnerable after a failure to energize Ripple buyers despite the notable swing higher.

Bitcoin price stalls at the upper trend line of a previous symmetrical triangle, nearly voiding the last two days of gains in the process. Ethereum price pursuing a new test of the 2020 rising trend line from the March 2020 low, offering a credible point of concern for the longer-term outlook for the smart contracts giant. XRP price jumps 26% over the previous two days, but the May 23 low remains instructive as resistance.
Bitcoin price fumbles rally, but 30,000 remains a firm support level
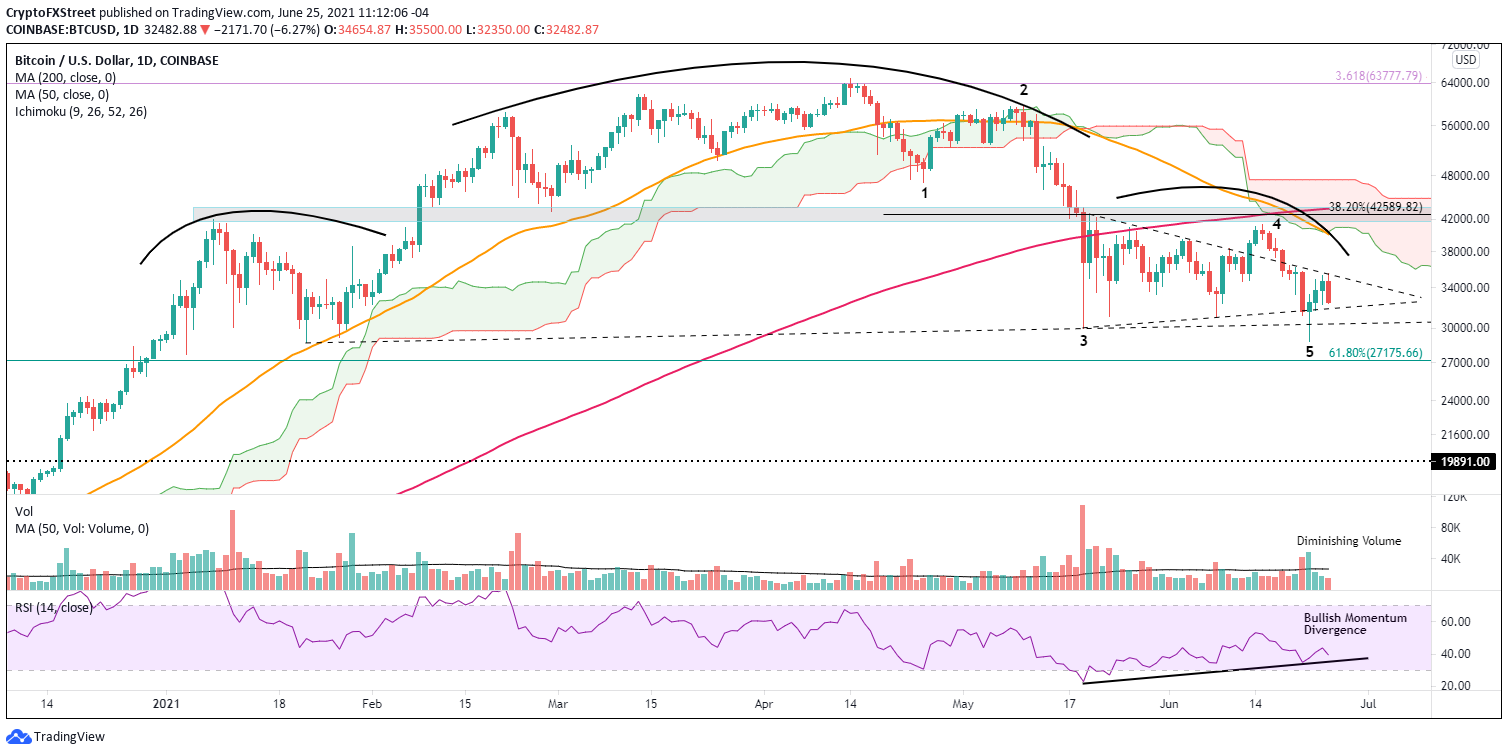
Bitcoin price has rallied 23% from the June 22 low of $28,800 to today’s high of $35,500, mainly overcoming the 11% decline on June 21. The rebound stalled today at the upper trend line of the longstanding symmetrical triangle, forcing a retracement today. The rebound was supported by one day with above-average volume, and the other two registered declining volumes, suggesting a waning commitment from BTC enthusiasts.
The developing retracement may see Bitcoin price test $30,000 as round numbers tend to carry a magnet effect for the price, as noted in the work of Monroe Trout. Depending on the surroundings in the altcoins, it may sweep the June 22 low of $28,800.
From a bigger picture, Bitcoin price did trigger the neckline of a head-and-shoulders topping pattern on June 22. The pattern remains active until the right shoulder high of $41,332 is defeated, thus slightly shifting the probabilities higher for a more profound decline moving forward. Potentially to the 61.8% Fibonacci retracement of the March 2020-April 2021 advance.
BTC/USD daily chart
Market dynamics can change quickly in the cryptocurrency complex, so it is imperative to consider the upside resistance levels and targets. A secure rally above today’s high of $35,500 will reinforce the staying power of a larger rally. Significant resistance appears at the convergence of the 50-day simple moving average (SMA) at $40,103 and the daily Ichimoku Cloud. Further resistance is at the right shoulder high of $41,322 and then the 200-day SMA at $42,604, offering a 22% return for investors using today’s high as the trigger.
An Elliot five-waves down pattern, bullish momentum divergence and remarkable support around $30,000 should contain any further weakness. Still, a daily close below the June 22 low of $28,800 will raise the probabilities of at least a more complex bottoming process or even a fresh leg lower.
Ethereum price wobbled higher as other altcoins leaped
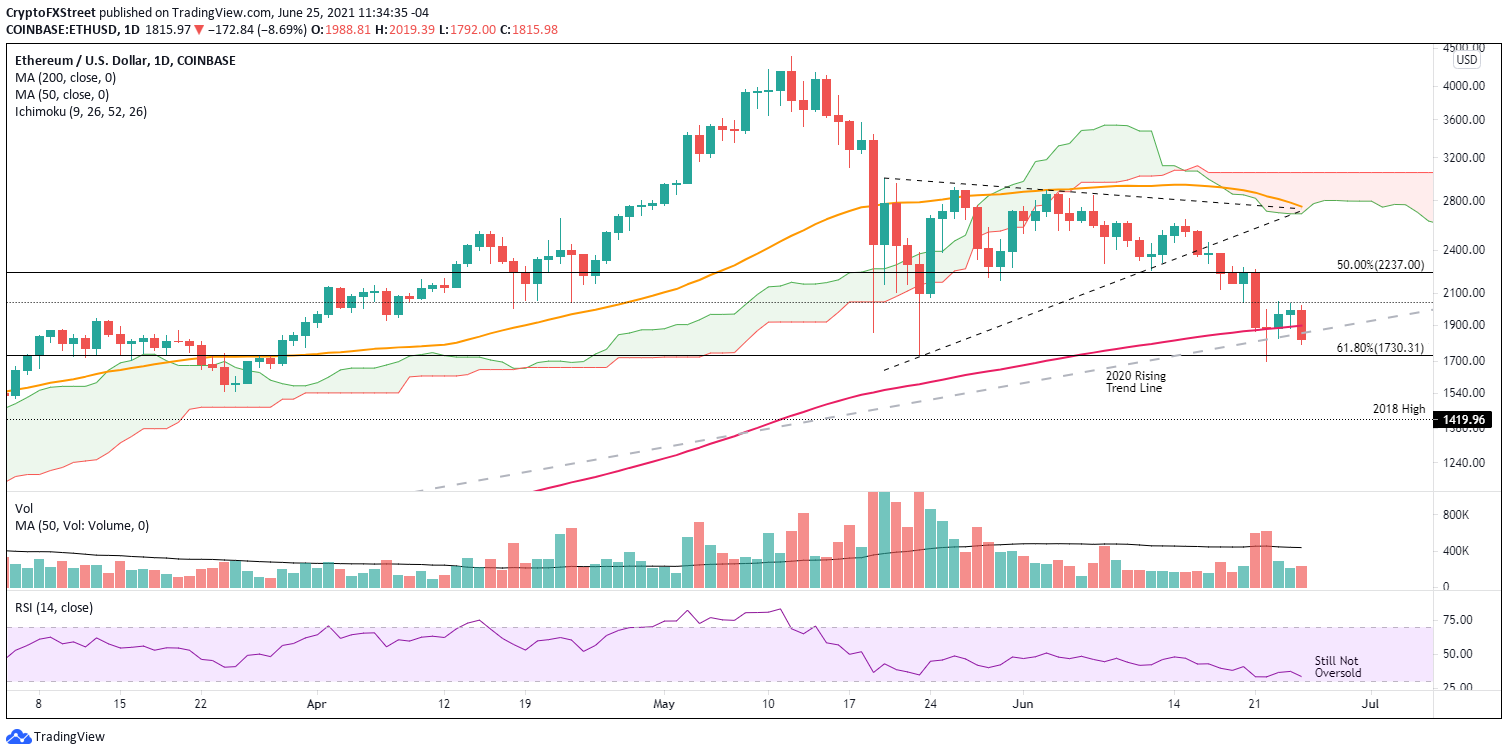
On June 22, Ethereum price printed a new swing low after busting the May 23 low of $1,728. ETH closed June 22 with a doji candlestick pattern on the 200-day SMA at $1,878, dictating indecision and a stalemate between sellers and buyers. The immediate response to the pattern was two wobbly days higher, yielding a 9% gain June 23-24. A far inferior return to Bitcoin and most altcoins.
Today Ethereum price is dropping 9%, putting the 2020 rising trend line at risk and the 61.8% retracement of the March 2020-May 2021 advance at $1,730 and the June 22 low of $1,700. A daily close below $1,700 will be a warning sign that it too is involved in a more complex bottoming process that may include a test of the 2018 high of $1,419 and a decline of 20% from the current price. The selling would finally push the daily Relative Strength Index (RSI) into an oversold condition.
ETH/USD daily chart
A close above $2,041, the February high and influential level, could introduce a new opportunity from the long side for ETH. Resistance will be discovered at the 50% retracement of the March 2020-May 2021 advance at $2,237. Still, a daily close above the retracement level should free Ethereum price to march higher to the confluence of the symmetrical triangle apex, 50-day SMA at $2,750 and the daily Ichimoku Cloud, presenting a 35% gain from $2,041.
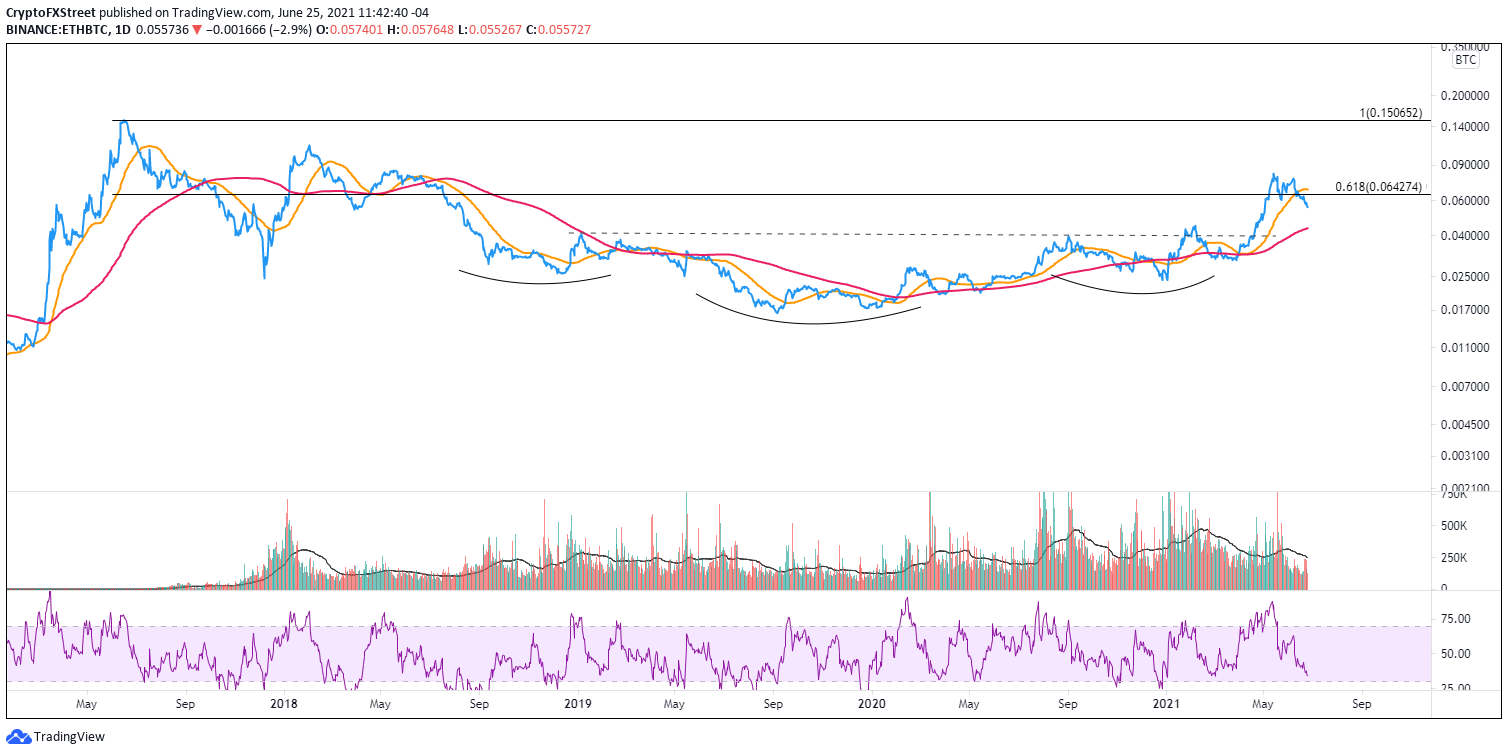
There is no other way to said it, Ethereum price has been zombie-like, showing no signs of relative strength against Bitcoin or other digital assets. The weak price profile is presented in the chart below, where Ethereum is about to make a new low versus Bitcoin. The daily RSI is still not oversold, pointing to lower prices in the short term.
ETH/BTC daily chart
XRP price may hesitate before rising in the summertime
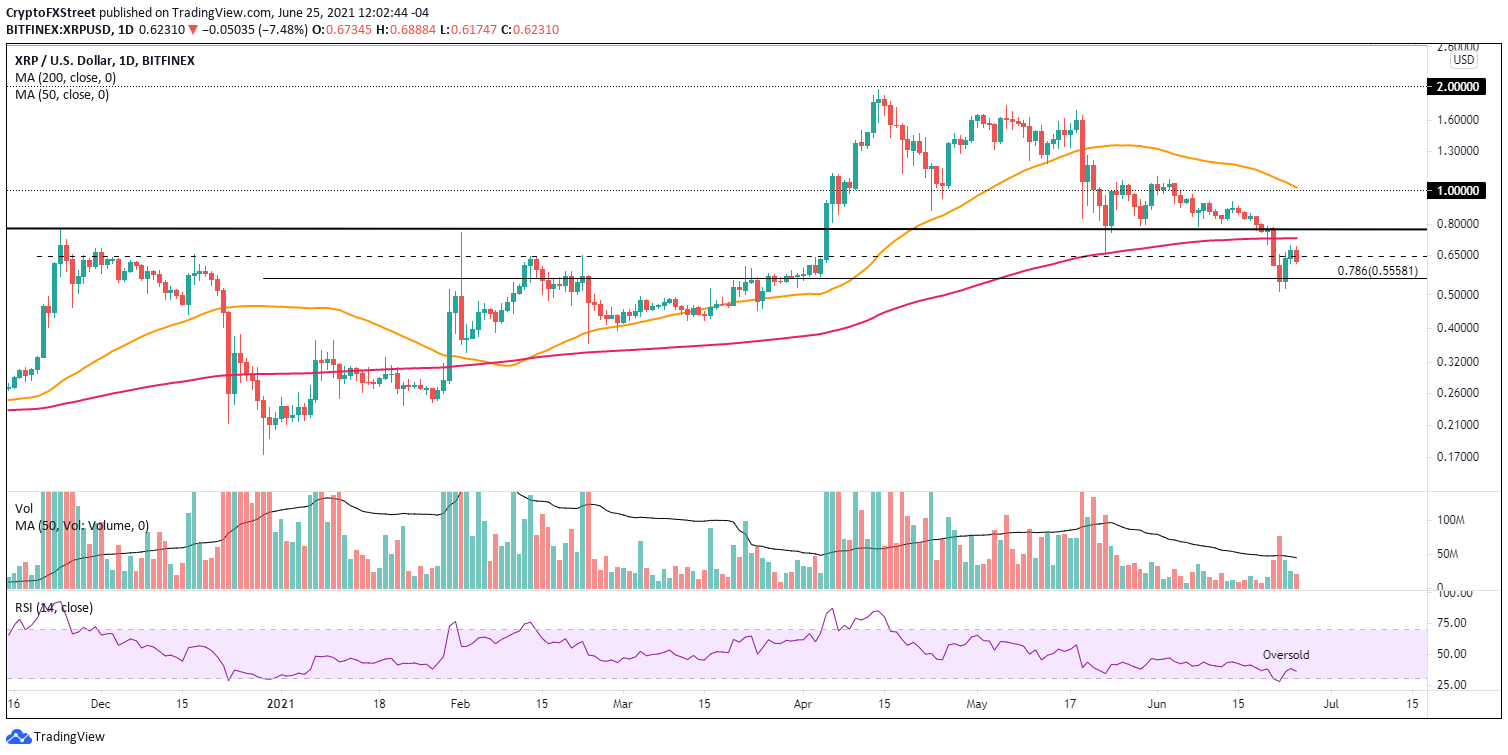
At the June 22 low, XRP price had declined 70% from the April high of $1.96 and an incredible 50% from the June 1 high while destroying the May 23 low of $0.652. Nonetheless, Ripple realized three important technical milestones that provoked a commanding level of support: a test of the 78.6% retracement of the December 2020-2021 advance at $0.555, a touch of the 50-week SMA at $0.539 and an oversold reading on the daily RSI for the first time since late December 2020. The result was a 35% rally from the June 22 low of $0.512 to the June 24 high of $0.692 and a close above the May 23 low of $0.652.
The daily close above $0.652 does raise the odds that XRP price has printed a formidable low, and the 78.6% retracement should contain any residual selling pressure at $0.555. A renewal of strong buying will be engaged by an intimidating level of resistance between the 200-day SMA at $0.728 and then the multi-year neckline of an inverse head-and-shoulders pattern at $0.760.
XRP/USD daily chart
A daily close below the June 22 low should discourage XRP investors and shift the crosshairs towards much lower prices.
Supporting a bearish outlook for XRP price is its performance versus Bitcoin. XRP/BTC broke below the neckline of a head-and-shoulders pattern on June 10 and proceeded to fall to the 200-day SMA. The magnitude of the decline has fallen short of the pattern’s measured move, suggesting that the XRP price could continue to underperform Bitcoin in the near future.
The underperformance could come with a giant swing lower than Bitcoin, a pause or a stronger BTC. Whatever the reason, XRP price could be staring at more short-term weakness until the measured move target is reached.
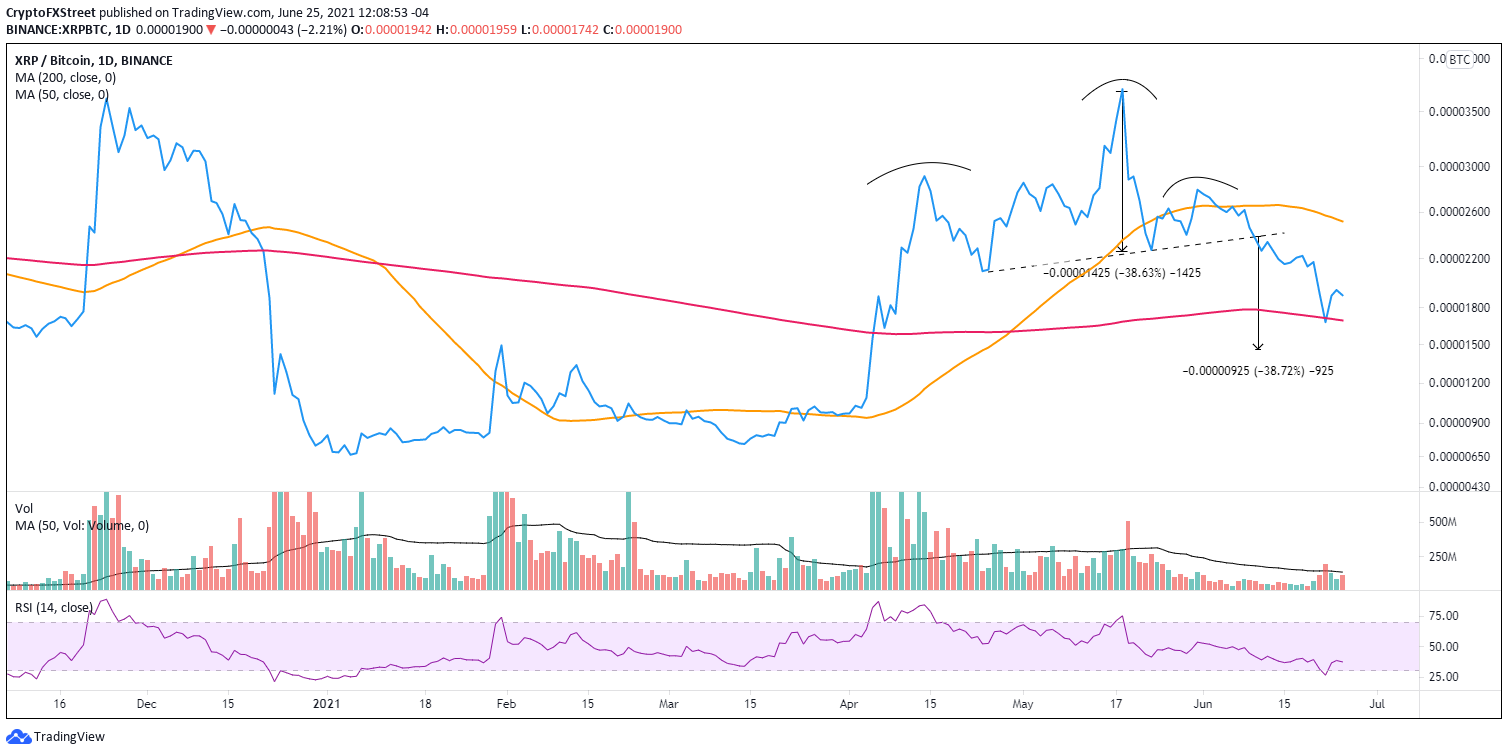
XRP/BTC daily chart
The oversold reading on the daily RSI may indicate that the underperformance may be limited.
The cryptocurrency market is a unique arena for market technicians. It is just supply and demand at its most extreme. There are no earnings, valuation metrics or government intervention (yet). Instead, fear and greed drive the ship, placing technical analysis at the apex for analysis and projections.
Author

Sheldon McIntyre, CMT
Independent Analyst
Sheldon has 24 years of investment experience holding various positions in companies based in the United States and Chile. His core competencies include BRIC and G-10 equity markets, swing and position trading and technical analysis.


