Three technical indicators suggest XRP price hit a market bottom
- XRP price tags 78.6% Fibonacci retracement of the December 2020-April 2021 advance.
- Daily Relative Strength Index (RSI) strikes an oversold reading, similar to the December 2020 and March 2020 lows.
- Ripple 50-week simple moving average (SMA) now in play, having served as support on several occasions.

XRP price is down over 70% from the April high and 50% from the June 1 rebound high at the time of writing, creating a challenging price structure to extract meaningful gains on a sustainable basis. However, today there is a convergence of three technical indicators that may signal that Ripple is near a new trading low or the beginning of a slow process of building an investable low for a new bull market.
XRP price endures by balancing close to the abyss
Before the current sell-off, XRP price had displayed a similar passiveness and lack of direction as many altcoins. Ripple was not inspired by the 30% rally in Bitcoin price, instead favoring to be range-bound between two imposing levels, the neckline of an inverse head-and-shoulders pattern at $0.76 and the psychologically important $1.00.
The range had not been accompanied by any signs of accumulation or distribution, raising the probability that XRP price would remain locked in the governing price range for the foreseeable future.
Over the last two days, the range resolved, and XRP price has fallen almost 34%, registering the largest two-day decline since December 2020 when the SEC case hit the news roll. As a result, Ripple has realized three important technical milestones: a test of the 78.6% retracement of the December 2020-April 2021 advance at $0.555, a touch of the 50-week SMA at $0.539 and marked an oversold reading on the daily RSI.
In the first Ripple chart below, the test of the 78.6% retracement and the RSI oversold condition is highlighted.
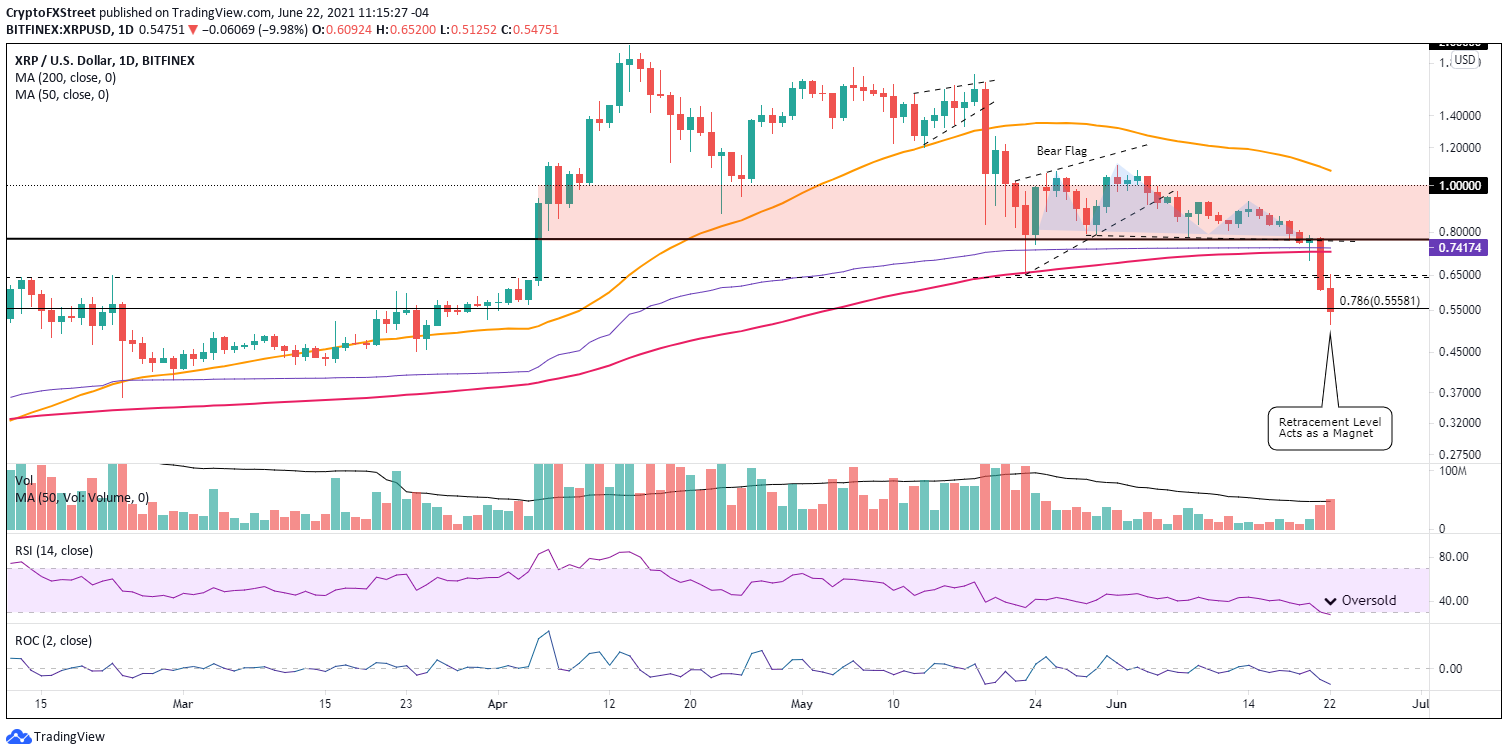
XRP/USD daily chart
The 50-week SMA is an important technical indicator for evaluating extreme deviations from the mean, macro oversold conditions and rally sustainability off significant lows. In the current Ripple case, the smoothed trend line has emerged as support. Therefore, if XRP price is to rebound, it should be around this price area.
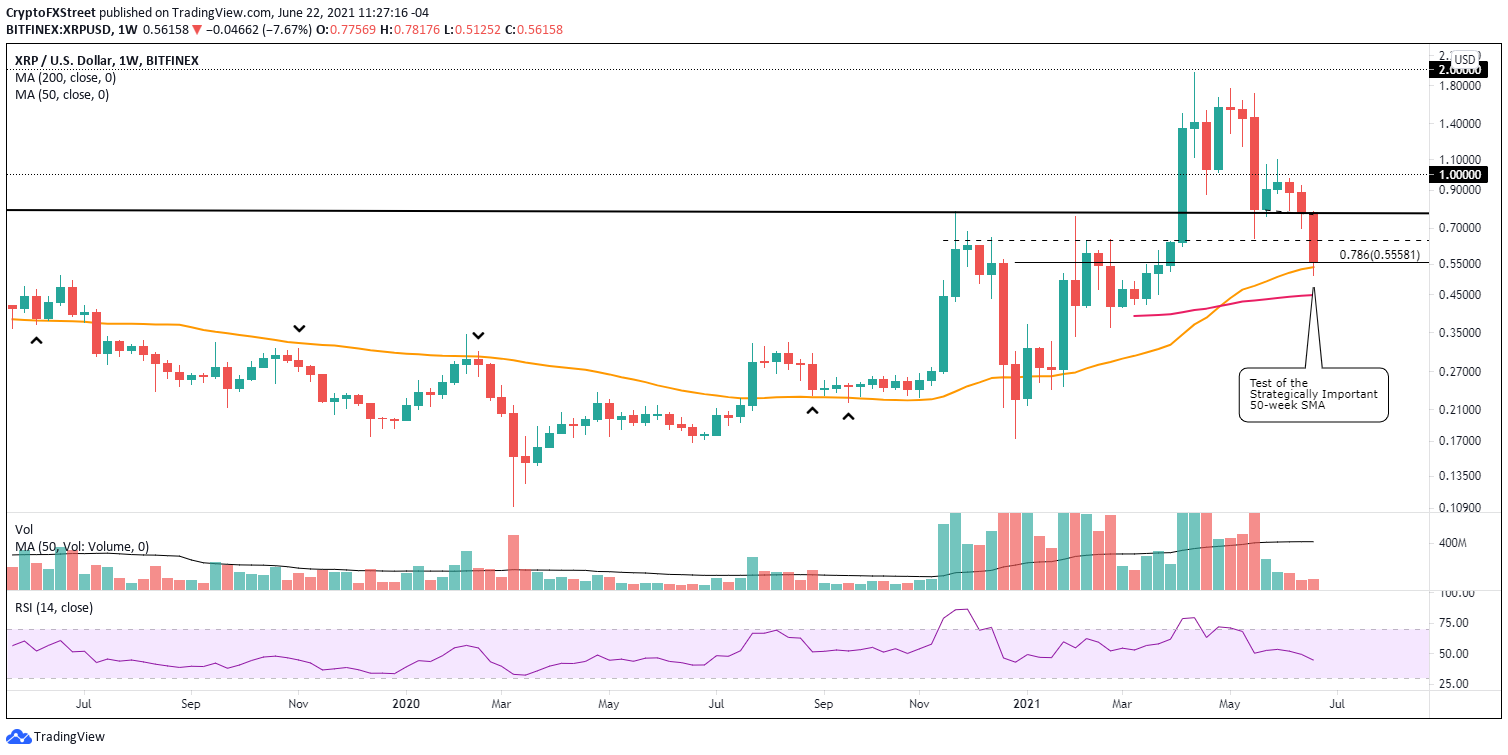
XRP/USD weekly chart
The sharpness of the current XRP price decline was too much for the May 23 low at $0.652 to contain. Still, the extension of the sell-off has now triggered three technical indicators that suggest a bottom has been reached, thereby stacking the probabilities in favor of at least a dead-cat bounce and potentially an investable low for committed Ripple investors.
Author

Sheldon McIntyre, CMT
Independent Analyst
Sheldon has 24 years of investment experience holding various positions in companies based in the United States and Chile. His core competencies include BRIC and G-10 equity markets, swing and position trading and technical analysis.


