Top 3 Price Prediction Bitcoin, Ethereum, Ripple: ETH says ‘no’ to profit taking, while BTC and XRP steady for a new surge
- Bitcoin price is forming the handle of a cup-with-high-handle base with a current measured move of 32%.
- Ethereum price solidifies gains above the upper trend line of the descending triangle pattern.
- XRP price continues to correct in time versus price after triggering a double bottom pattern on July 28 with an explosive gain of 13.41%.

Bitcoin price, Ethereum and XRP are consolidating their notable rallies off the July 20 low after striking established resistance levels. As of today, the corrective processes remain constructive and have not disarmed any of the critical support levels that would endanger the bullish outlook for the three crypto majors.
Bitcoin price preparing to transition from bear market bounce to bull market
At this moment, there is no doubt that Bitcoin price has established a firm correction low as the magnitude and sustainability of the rally has exceeded other rebounds during the correction while triggering a durable bottoming pattern. Moreover, the BTC rally is characteristic of moves that have marked a local top, or in some cases, the end of the advance, therefore establishing the impulsiveness that is required to overcome the trifecta of resistance now in play.
The first point of importance in the resistance is the June 15 high of $41,322, followed by the 38.2% Fibonacci retracement of the April-June correction at $42,589 and then the February 28 low of $43,016. At the August 1 high, Bitcoin price was 16 points below the 38.2% retracement level, affirming the importance.
If you zoom out, it becomes clearer that Bitcoin price is defining the handle of a cup-with-high-handle base. The bullish development creates a measured move of 32% from the handle high, with a final price target of $56,239. The target aligns with a formidable range of price congestion that extends back to the February high. Furthermore, it represents a constructive transition from an oversold bounce into a new BTC bull market.
Critical to the bullish narrative and forecast is the support embedded in the June 29 high of $36,675. A correction to the Bitcoin price level would be the ideal situation. Otherwise, BTC is exposed to a test of the rising 50-day SMA at $34,855. It would equate to an approximate fall of 18% from the handle high but still in the depth range of a healthy handle.
Any weakness below the 50-day SMA would provoke a reassessment of the bullish BTC outlook that has successfully projected the Bitcoin price action from the July low.
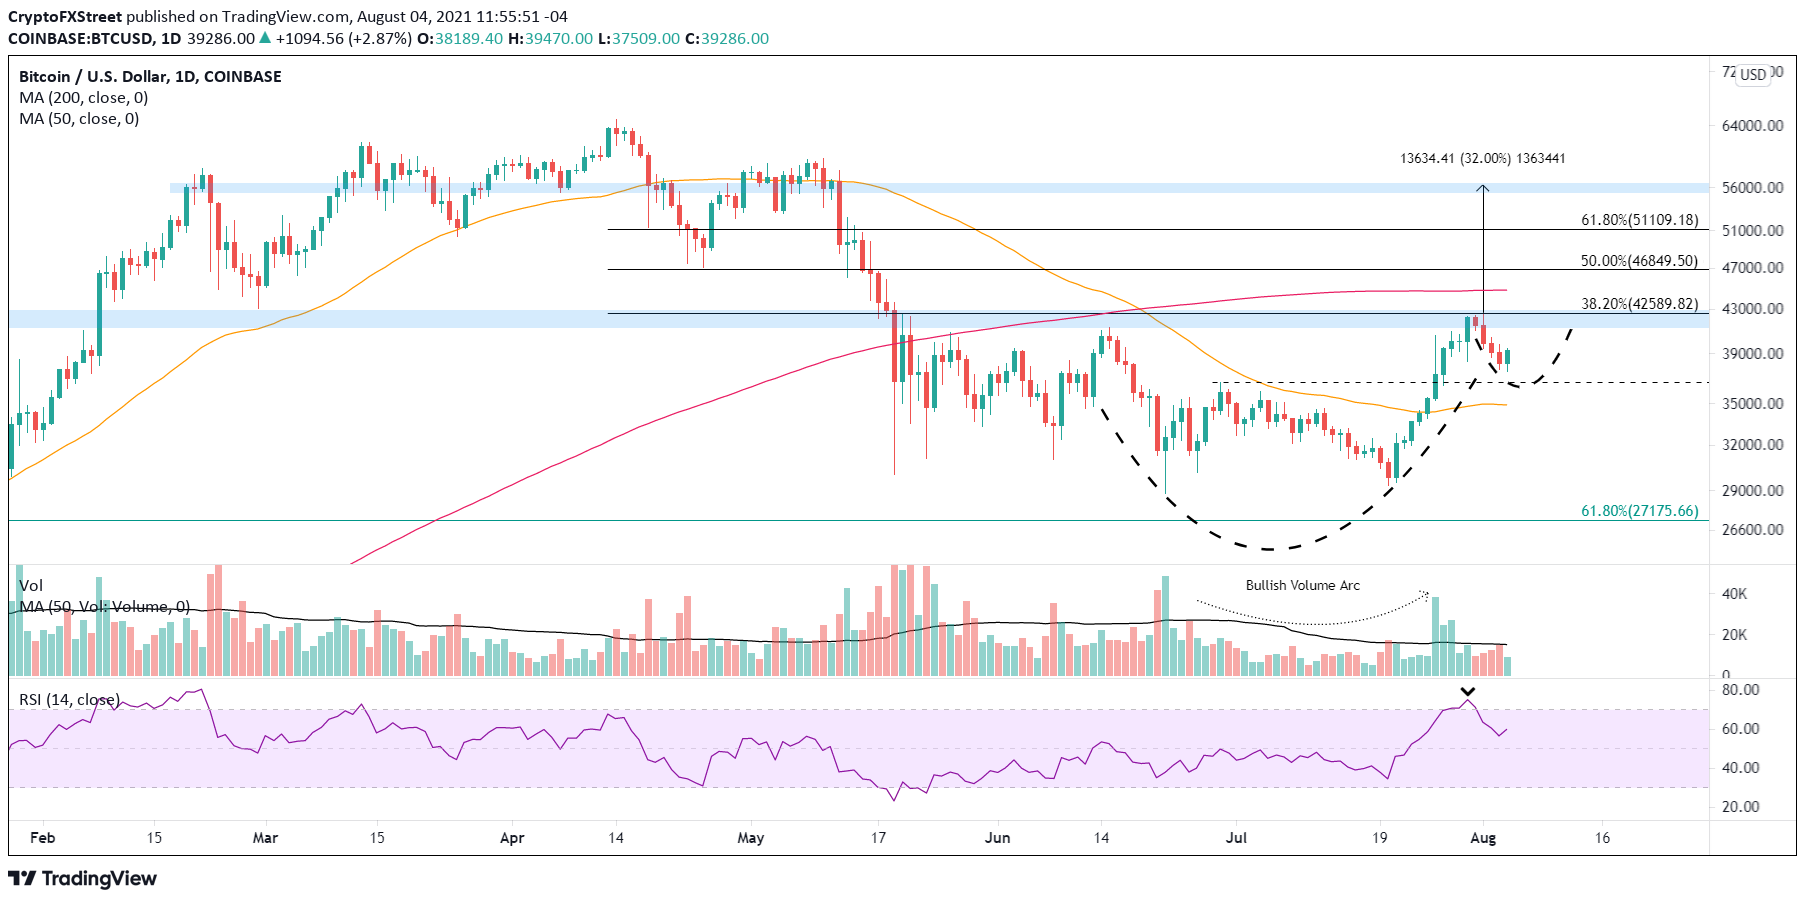
BTC/USD daily chart
An immediate renewal of Bitcoin price strength would discover resistance at the 200-day SMA at $44,764, followed by the 50% retracement at $46,849 and then the $51,109, before tagging the measured move target of $56,239, leaving BTC just 15% away from the all-time high of $64,899, printed on April 14.
The ideal scenario was for a correction in time versus price. Still, the evolution of the charts into a bullish cup-with-high-handle base has improved the probabilities that Bitcoin price will survive the trifecta of resistance and transition into a bull market. For now, it is about patience and maintaining an eye on the depth of the corrective process.
Ethereum price is relentless in the pursuit of bullish outcomes
Ethereum price is now up 14 of the last 15 days, yielding a 49.54% return at the time of writing and proving the relentlessness of the underlying bid. It is not the largest gain over 15 days as ETH reached 77.22% in May, 55% in February and 109.76% in January. Nevertheless, it is a solid continuation from the bullish outside week two weeks ago.
With the 6.11% gain today, Ethereum price appears to be overcoming the resistance defined by the Ichimoku Cloud after pulling back from the August 1 high of $2,699 and defending the upper trend line of a descending triangle pattern that had governed ETH since the March collapse.
If the ETH breakaway from the Cloud is sustained on a closing basis, Ethereum price may quickly rally to the $2,900-$3,000 range where May and June’s highs align. A test of that range would result in a 74% return from the July 20 low.
For additional interest in the ETH bull case, FXStreet published an article on July 20 discussing three reasons why Ethereum price would rally.
ETH/USD daily chart
Of course, things could change for ETH or the cryptocurrency complex moving forward. If Ethereum price resumes the consolidation, the upper trend line of the descending triangle at $2,390 should be credible support. However, a failure to hold will press ETH down to the 2020 ascending trend line at $2,230 or the union of the 200-day SMA with the 50-day SMA around $2,160.
A failure to hold the moving averages puts Ethereum price in a precarious situation that will prompt a reconsideration of the bullish narrative. Still, the London fork has put ETH in a position to succeed moving forward, with the most challenging resistance of the past now acting as support.
XRP price close to shining again, yet so far
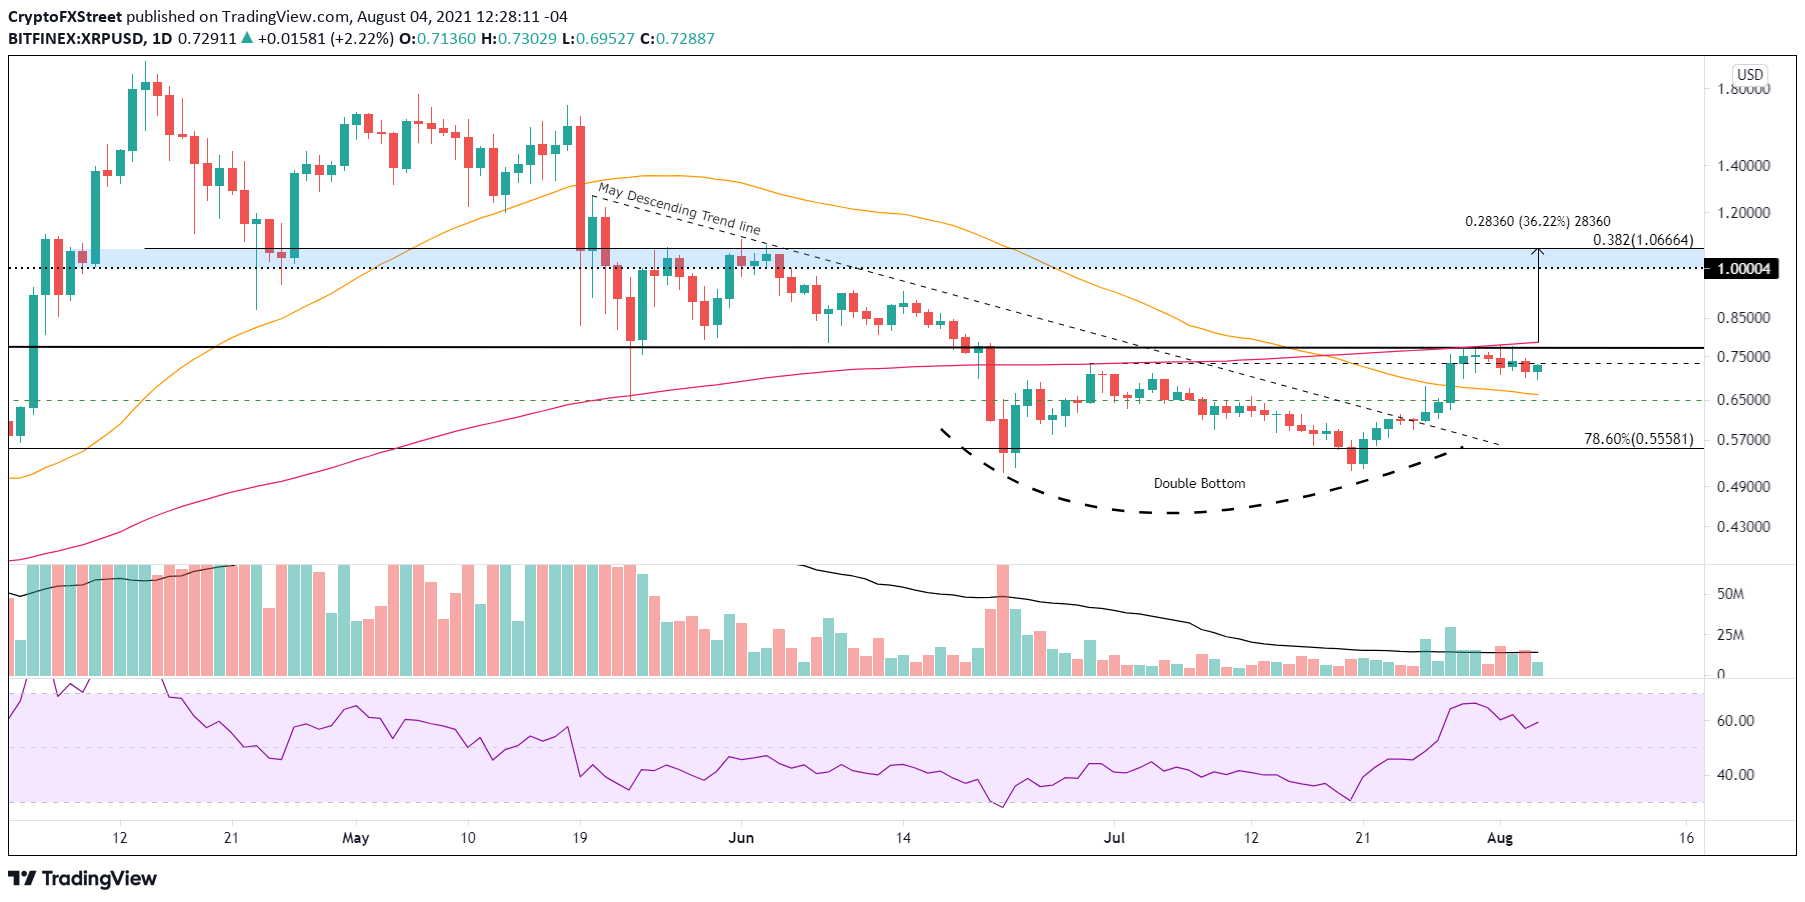
On July 29, XRP price triggered a double bottom pattern with a daily close above $0.733 after easily besting the 50-day SMA and touching the staggering resistance framed by the 200-day SMA and the neckline of a multi-year inverse head-and-shoulders pattern around $0.772.
Over the last five sessions, XRP price has been drifting lower, showing a correction in time versus price and affirming a definitive underlying bid for Ripple.
The Ripple double bottom pattern’s measured move is just over 30%, proposing a price target of $0.953 based on the pattern trigger price of $0.733. The target is below the significant resistance designed by the psychologically important $1.00 and the 38.2% retracement level of the April-June correction at $1.06.
To reach the measured move price target and the higher resistance between $1.00 and $1.06, XRP price needs to subdue the resistance of the 200-day SMA at $0.783. A daily close above the moving average would be a timely point to add to an existing Ripple position or initiate. It would put Ripple on pace for a 36% gain from the moving average to $1.06 and position it to shine the light on a new bull market advance.

XRP/USD daily chart
If the XRP price corrective process shifts from just being in time, Ripple should maintain weakness to the confluence of the 50-day SMA at $0.660 with the May 23 low of $0.652. A fall below those levels puts the bullish outlook on hold and raises the probability of a new correction low.
All three cryptocurrency majors have demonstrated impulsiveness off the July lows that are consistent with a sustainable advance. However, Bitcoin and XRP prices have met sturdy resistance and are consolidating the gains in a constructive process. Meanwhile, Ethereum price has continued the momentum, shedding the magnet effect of the upper trend line of the descending triangle with sights set on higher ETH levels in the near term.
Author

Sheldon McIntyre, CMT
Independent Analyst
Sheldon has 24 years of investment experience holding various positions in companies based in the United States and Chile. His core competencies include BRIC and G-10 equity markets, swing and position trading and technical analysis.


