Top 3 Price Prediction Bitcoin, Ethereum Ripple: Cryptos await breakout while ETH hits all-time high
- Bitcoin price develops bullish continuation pattern, hinting at an imminent, future bullish breakout.
- Ethereum hits a new all-time high, but the response by market participants is muted.
- XRP price wallows in indecision and confusion.

Bitcoin price shows a bull trap is forming on its $1,000/3-box reversal Point and Figure chart, confirming any breakout above the bull flag on the candlestick chart is likely to be sustained. Ethereum price struggles to push higher as momentum seems to drain away. XRP returns inside the Cloud and continues to frustrate bulls and bears alike with directionless movement.
Bitcoin price looks for another breakout to an all-time high
Bitcoin price remains roughly 10% below the new all-time highs it established on October 20th. The pullback has been steady and very controlled in nature and void of many of the massive double-digit percentage losses experienced in the majority of the alt-coin markets. A bear trap pattern is developing on the $1,000/3-box reversal Point and Figure chart giving buyers a theoretical trade opportunity. The possible long entry would be a buy stop at $67,000, a stop loss at $64,000 and a projected profit target at $75,000.
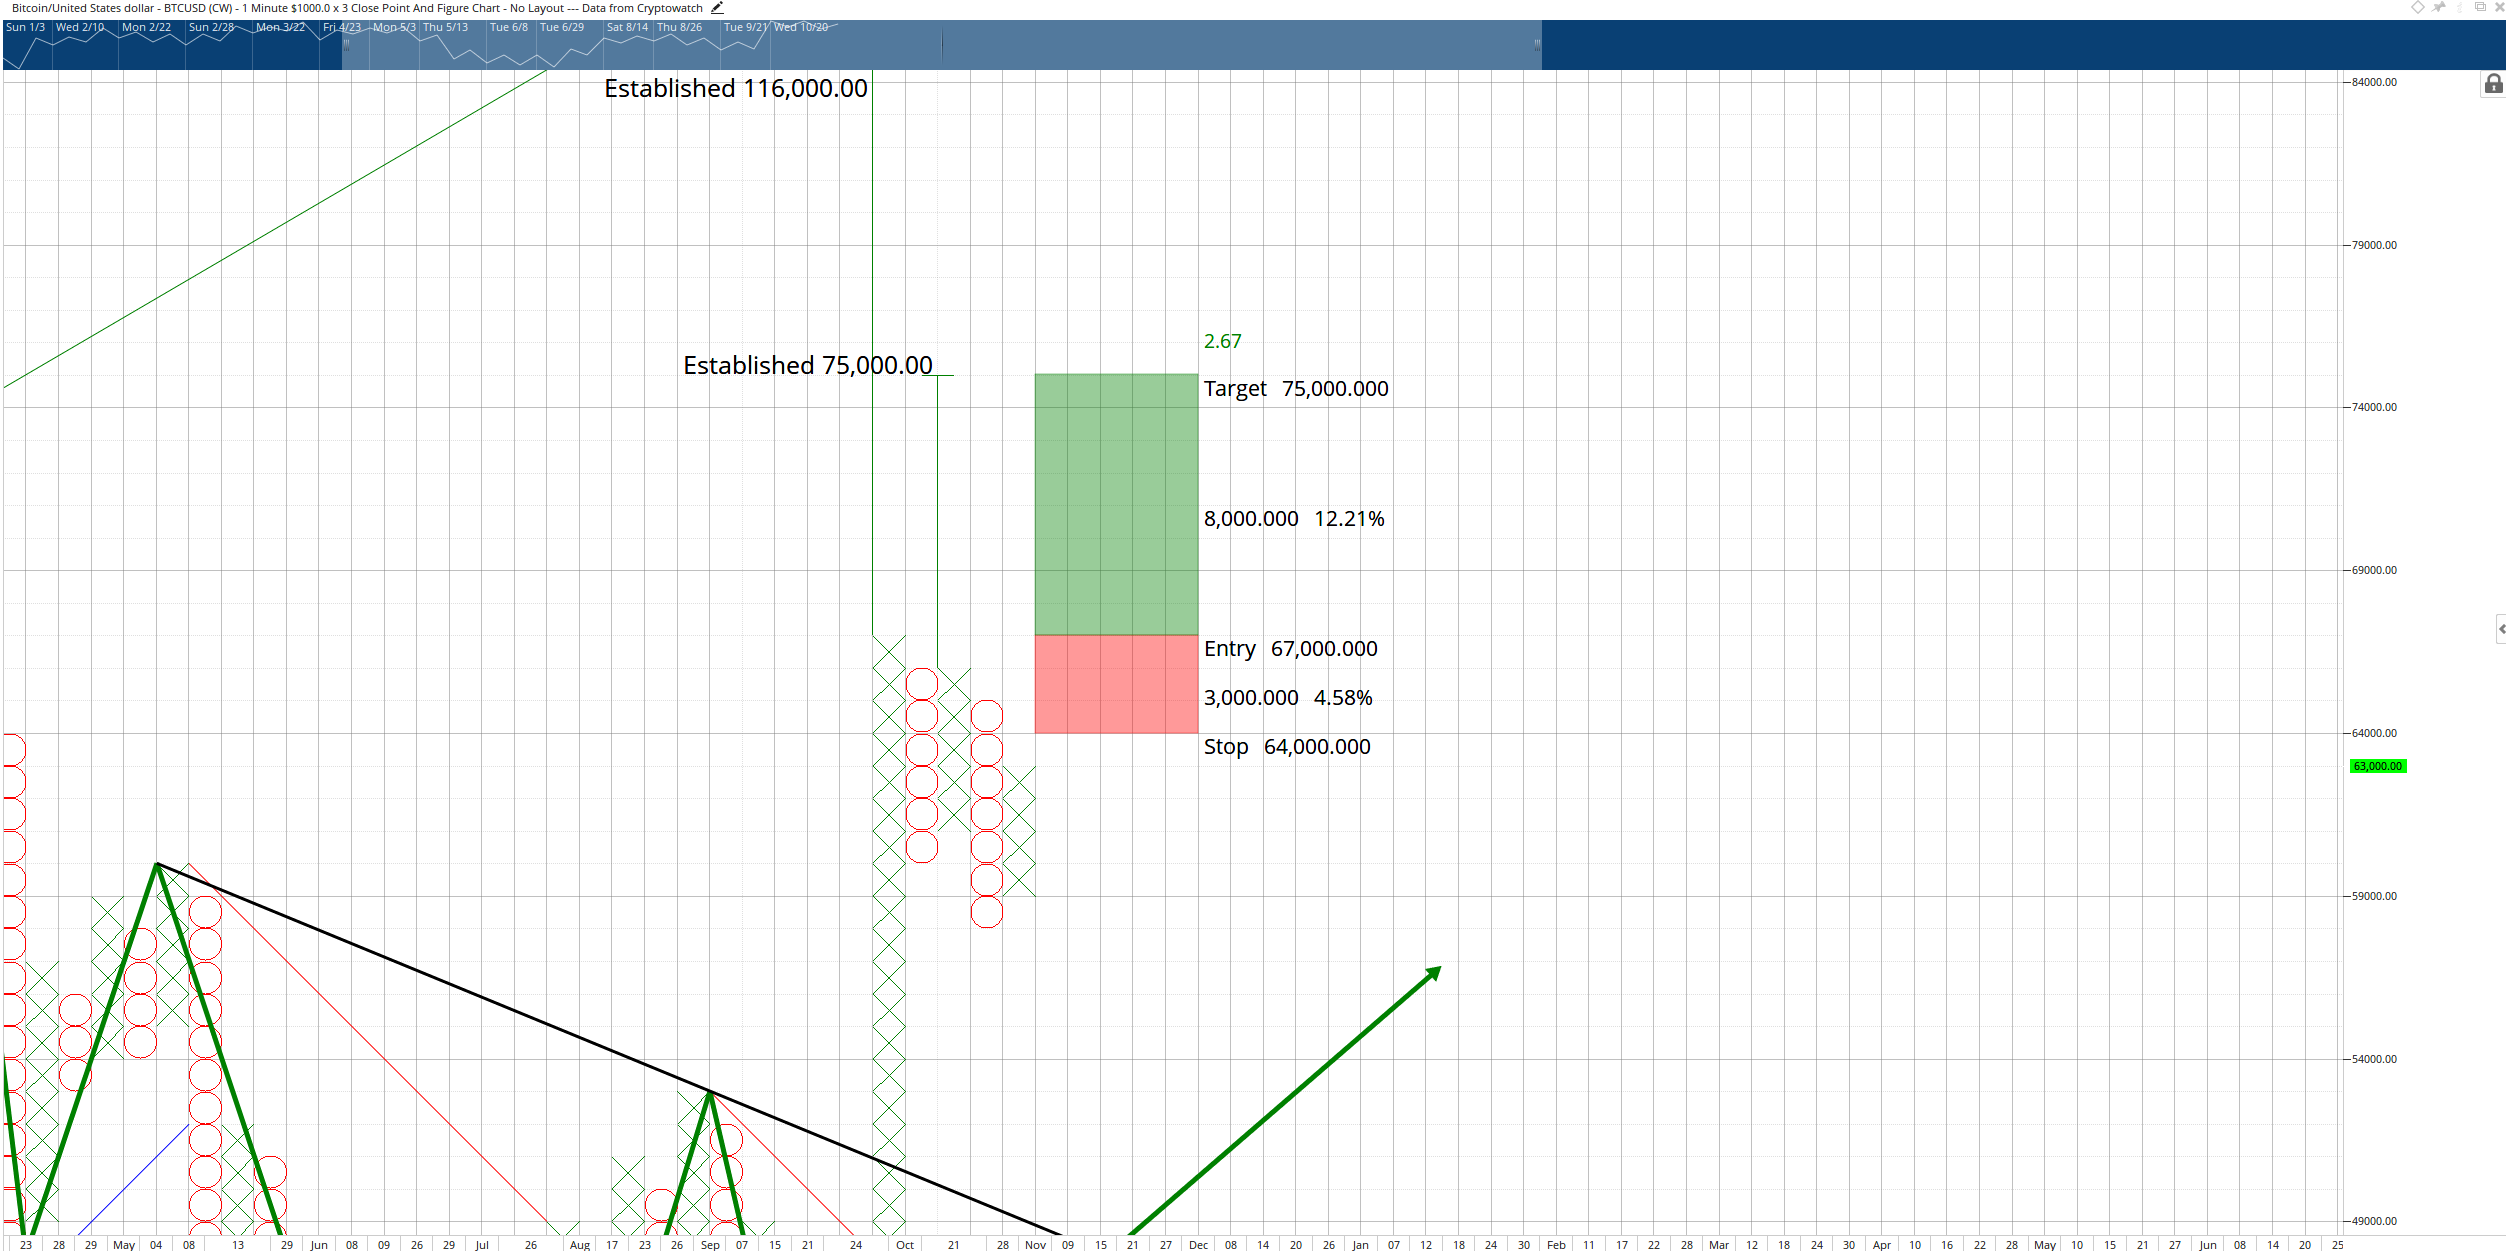
BTC/USD $1,000/3-box Reversal Point and Figure Chart
The hypothetical long entry will be invalidated if a new O-column develops and pushes lower to $57,000. Thus, Bitcoin price will likely find support on any pullback between $54,000 and $57,000.
Ethereum price action shows a lack of conviction by buyers
Ethereum price finally hit a new all-time high, coming back almost one week after the most recent failed attempt. The volume, however, appears to be slowing, and the momentum is dropping for Ethereum. As a result, buyers are unable or unwilling to push Ethereum higher and further into new all-time highs. This behavior is concerning because Ethereum often spikes considerably upon reaching new all-time highs.
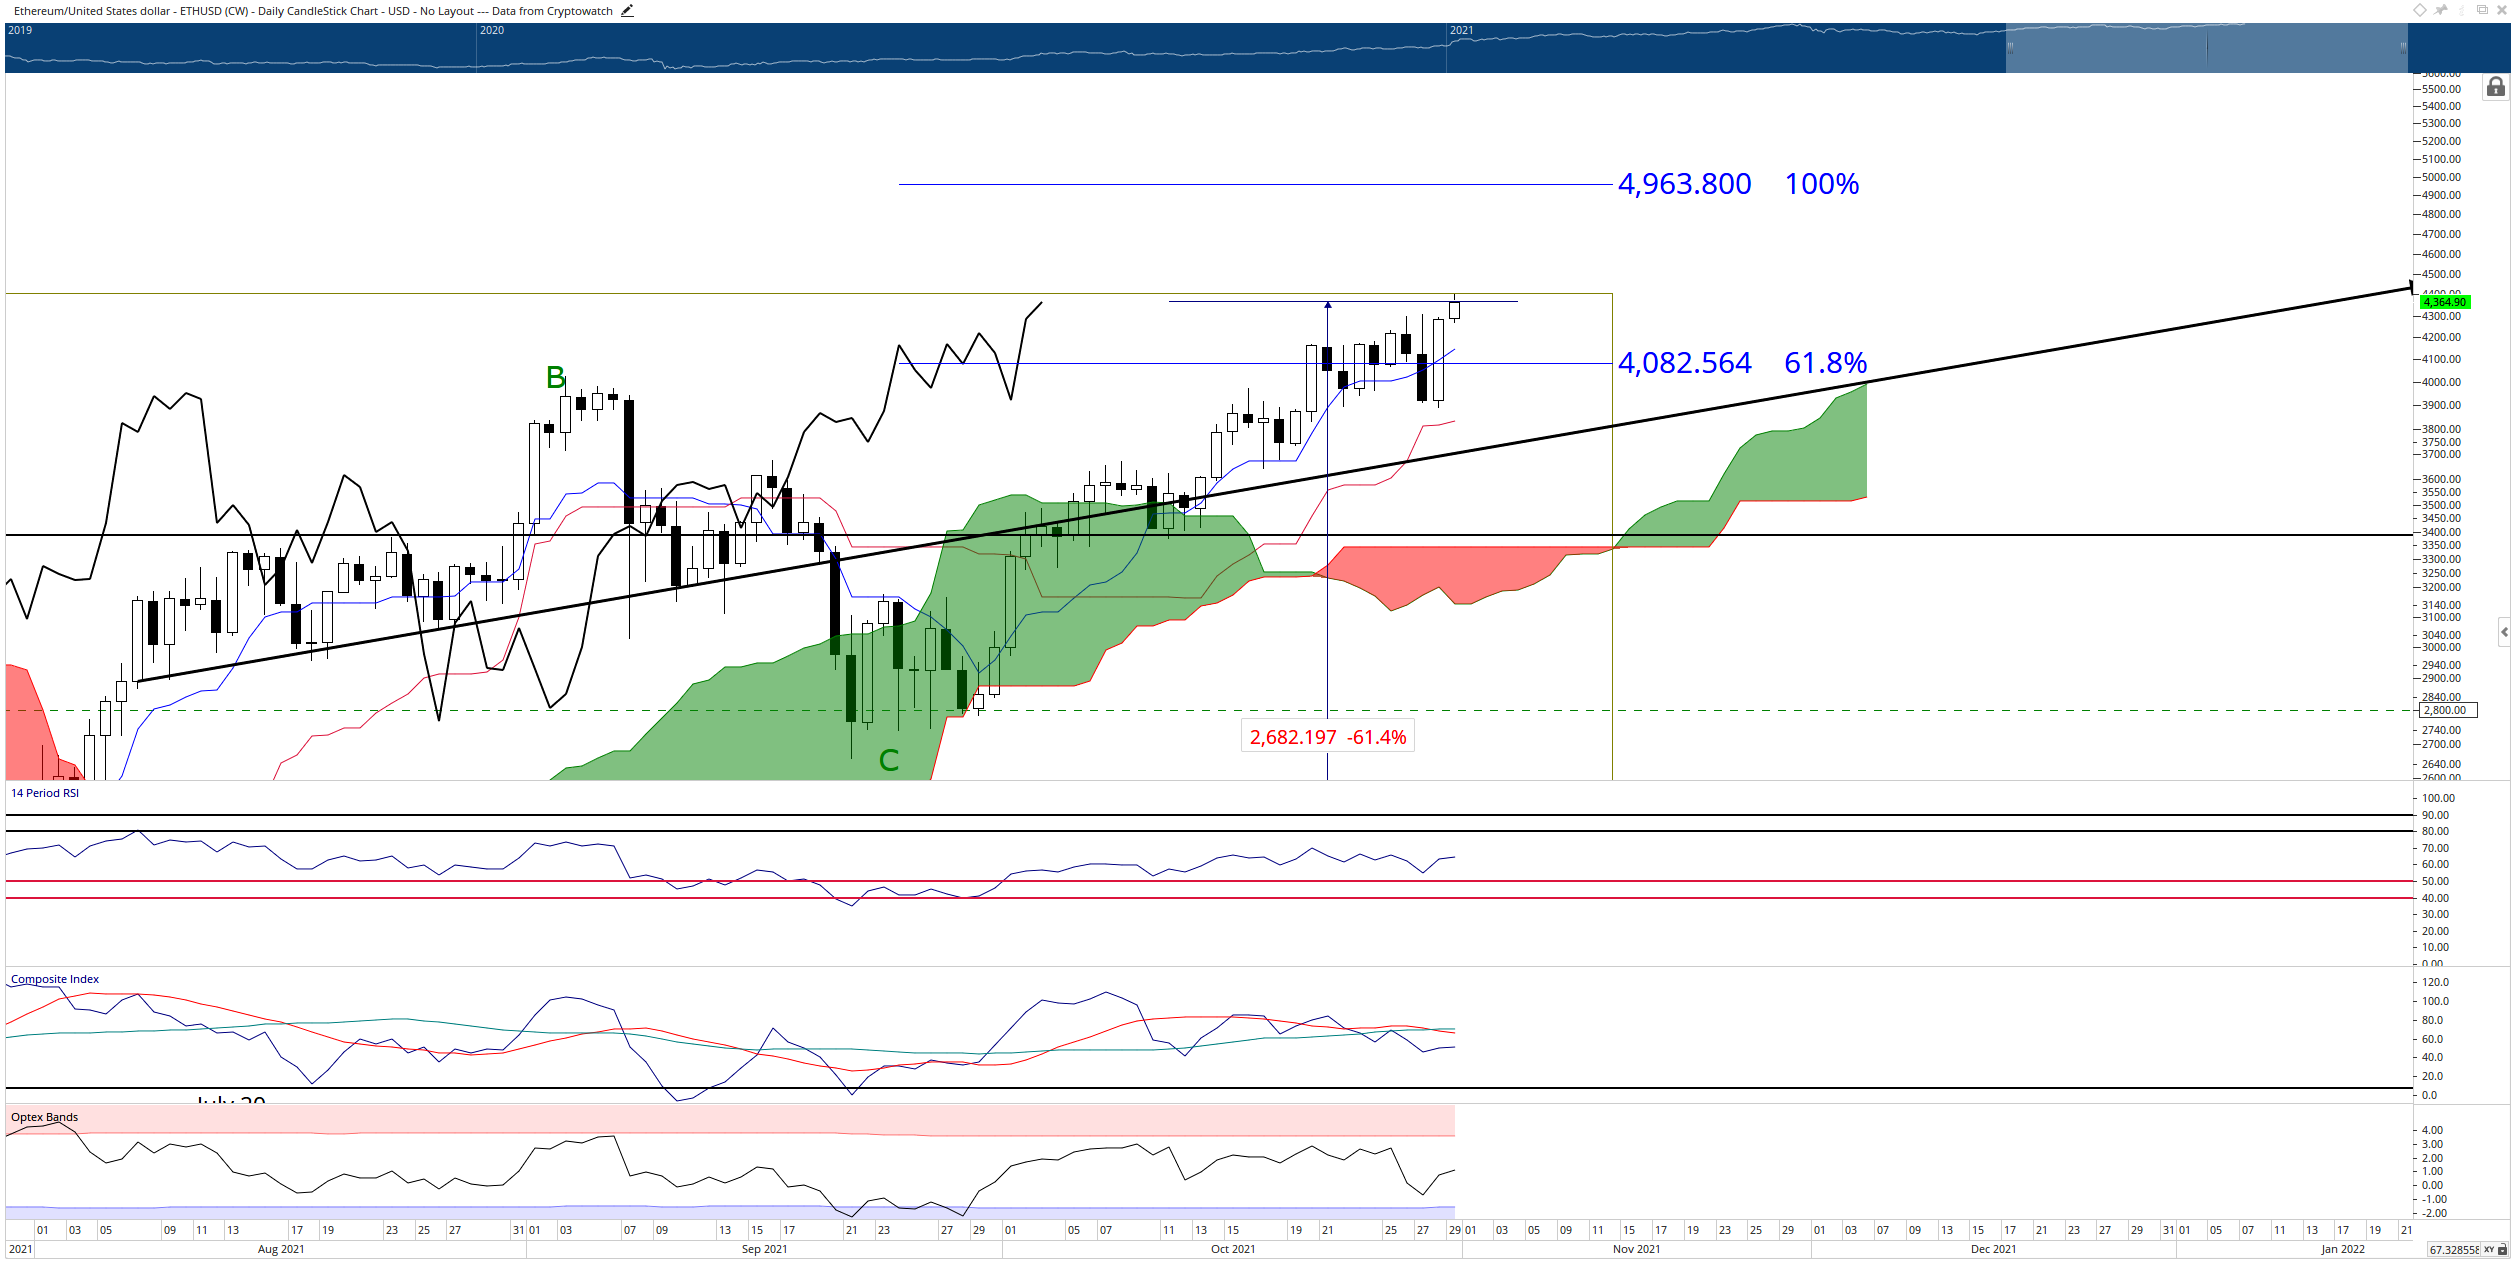
ETH/USD Daily Ichimoku Chart
The $4,000 value area should be a good source of support Ethereum price as it contains the 61.8% Fibonacci expansion level and the Tenkan-Sen. By Saturday and Sunday, the Kijun-Sen will have moved slightly higher to the $4,000 level as well. Upside potential may be limited to the psychological $5,000 level, which is also the 100% Fibonacci expansion.
XRP price continues to display volatility and indecision
XRP price has recovered most of the losses it sustained during the Wednesday sell-off. However, it has returned inside the Cloud and resumes its previous trading behavior of confusion and indecision. For a bullish trend to begin, XRP price must close at or above $1.15 – essentially a daily close above the Cloud. At that point, XRP would be above the Tenkan-Sen and Kijun-Sen, too. Additionally, the Chikou Span would be above the candlesticks and Cloud. A push towards $1.50 would be the next target.
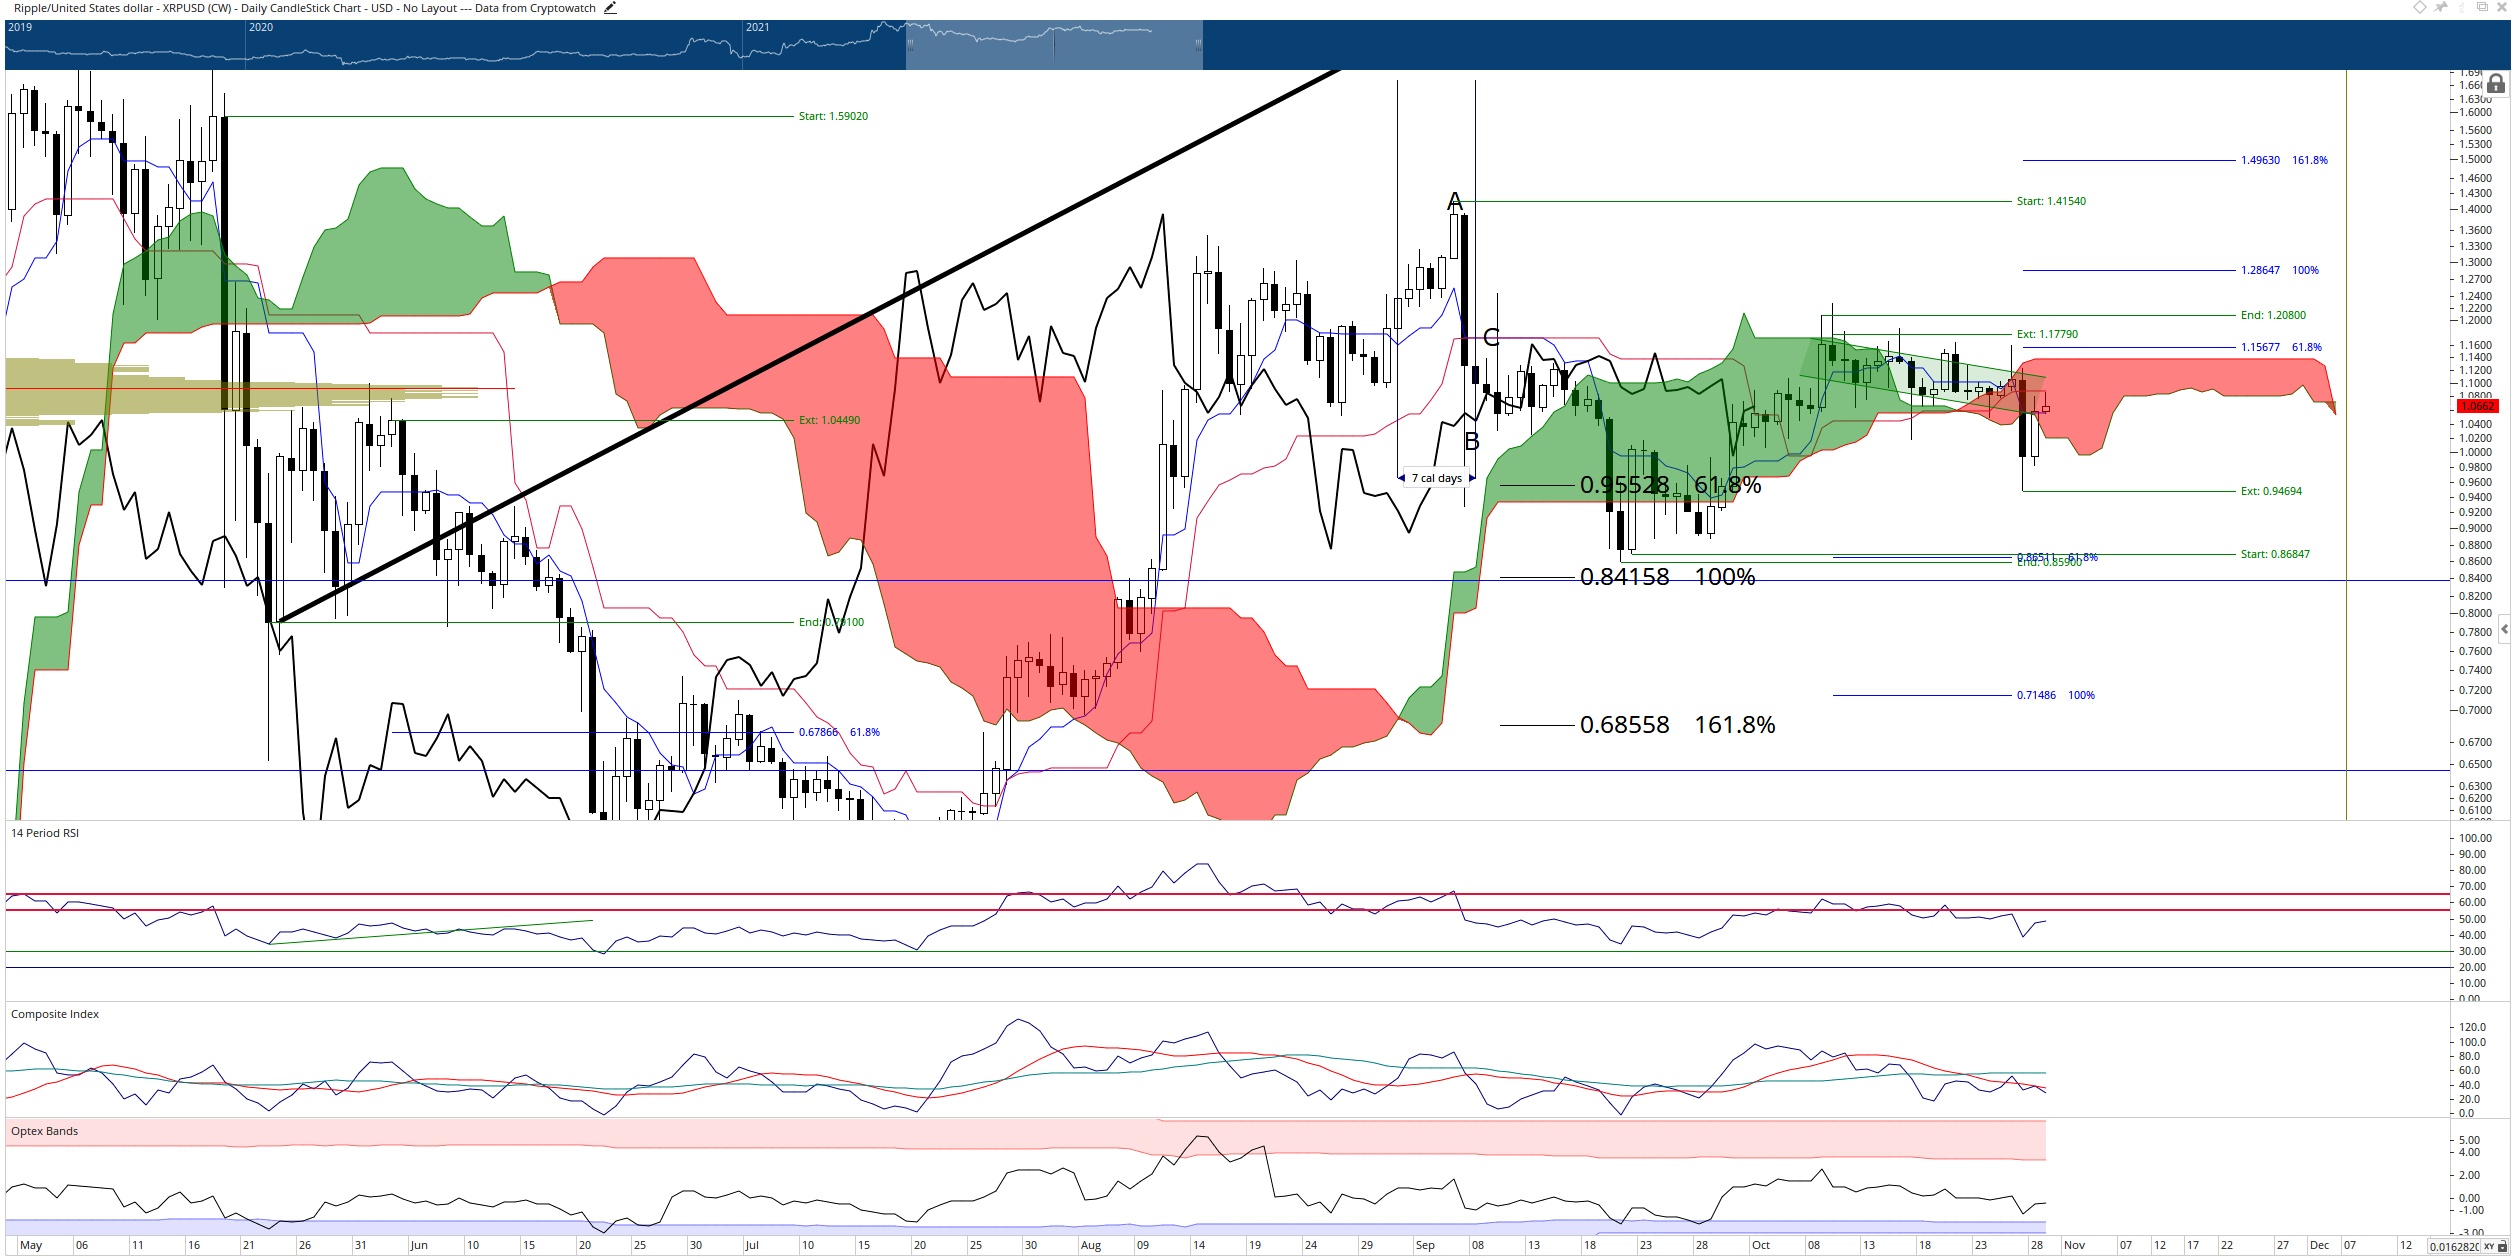
XRP/USDT Daily Ichimoku Chart
However, bearish sentiment is also present. A daily close below $0.98 could trigger fast-selling pressure towards the low $0.80 value area. And if support fails to hold there, then the $0.60 is next.
Author

Jonathan Morgan
Independent Analyst
Jonathan has been working as an Independent future, forex, and cryptocurrency trader and analyst for 8 years. He also has been writing for the past 5 years.